
Figures & data
Table 1. Patient characteristics. Previous treatments indicate systemic therapy for metastatic disease. .
Figure 1. Correlation of paired primary and metastatic tumor samples. Gene expression was assessed using the 770-gene NanoString PanCancer IO 360™ Panel. The scatter plots visualize correlation of the paired primary (x-axis) and metastatic (y-axis) melanoma patient samples. Selected genes with log2 fold change >3 are highlighted in the plots. R denotes Pearson correlation coefficient.
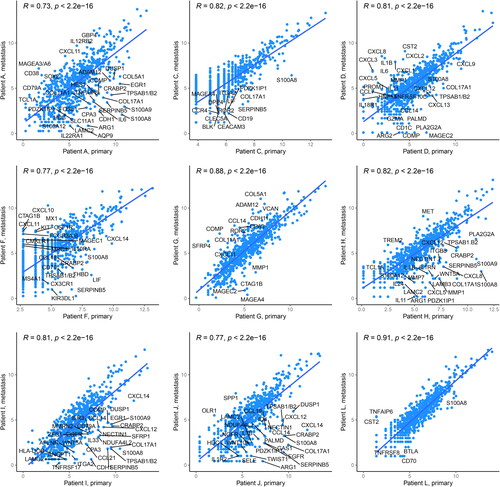
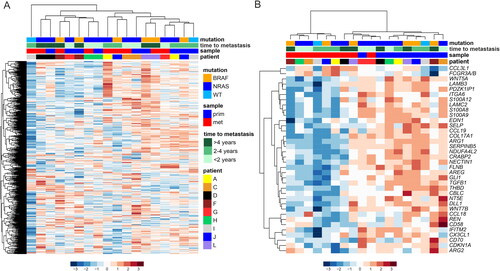
Figure 2. Gene expression profiles in the primary and metastatic melanoma patient samples. (A) Unsupervised hierarchical clustering of the NanoString PanCancer IO 360™ Panel genes in paired primary (n = 9) and metastatic (n = 9) melanoma samples. The heatmap was generated using Euclidean distance with ward.D linkage. The rows in the heatmap denote genes and columns samples. The data were z-score normalized, scaled row-wise, and blue color denotes lower expression and red color higher expression. The upper panel shows annotation of the samples. (B) The heatmap visualizes differentially expressed genes between paired primary and metastatic melanoma samples (p < 0.01, moderated t-test by paired “limma” analysis). prim: primary; met: metastasis.
Data availability statement
The data supporting the findings of this study are available from the corresponding author, upon reasonable request.