
Figures & data
Figure 1. Flow chart.
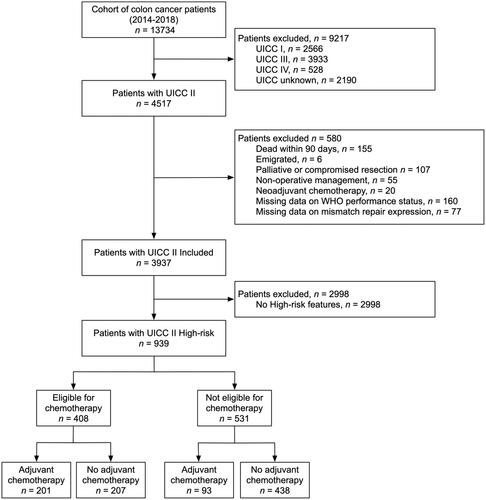
Figure 2. a. Kaplan-Meier survival curve of 408 eligible high-risk UICC stage II colon cancer patients. b. Kaplan-Meier survival curve of 182 eligible high-risk UICC stage II colon cancer patients with pT4 tumors.
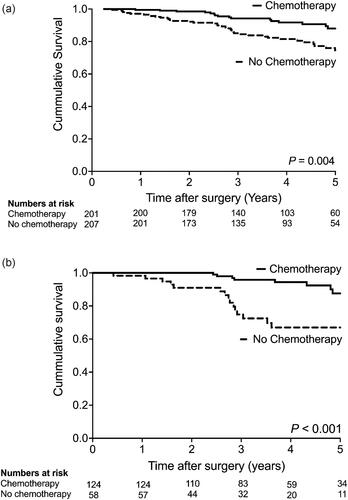
Table 1. The distribution of high-risk features in 939 patients with UICC stage II colon cancer alive 90 days after resection.
Table 3. Type of adjuvant chemotherapy in 939 patients with high-risk UICC stage II colon cancer.
Table 2. Differences in 408 eligible patients with high-risk UICC stage II colon cancer according to administration of adjuvant chemotherapy.
Supplemental material
Supplemental Material
Download MS Word (13.5 KB)Supplemental Material
Download MS Word (14.1 KB)Supplemental Material
Download MS Word (16.2 KB)Supplemental Material
Download MS Word (16.3 KB)Supplemental Material
Download MS Word (60.6 KB)Supplemental Material
Download MS Word (109.9 KB)Data availability statement
Due to the nature of the research and due to ethical and legal restrictions, data is not available.