
Figures & data
Figure 1. Study population of patients with MPN and matched nonMPN comparators.
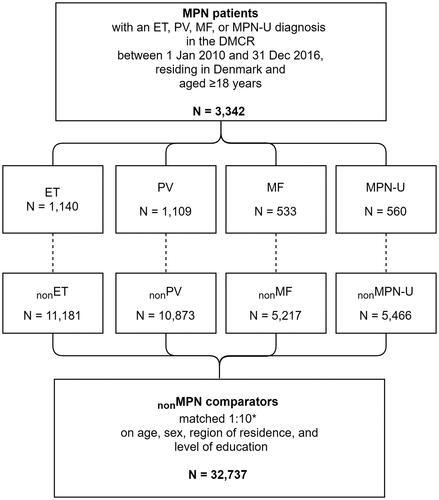
Table 1. Characteristics of the study population at index date.
Figure 2. Labor market affiliation as proportions by week for each diagnosis group from two years before until two years after diagnosis.
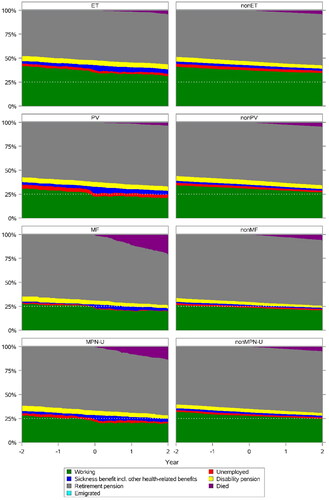
Table 2. Labor market affiliation in proportions pre- and post-diagnosis (cross-sectional), stratified by diagnosis group.
Table 3. Labor market affiliation in proportions at index week (cross-sectional), stratified by diagnosis group.
Supplemental Material
Download PDF (165.2 KB)Supplemental Material
Download MS Word (543.3 KB)Data availability statement
Data presented in this study were obtained from Danish registries and handled remotely at secured servers at Statistics Denmark. Owing to the guidelines by Statistics Denmark, the authors are not allowed to share individual-level data. Anonymized data (including counts reported as '≤5' persons) are shared in the manuscript. Other researchers who fulfil the requirements set by the data providers could obtain similar data.