
Figures & data
Figure 1. Interface of ‘Wedge Film Calibration’ in DoseLab. The input files are the pre-determined ‘*-profile.xls’ file from manual calibration. The Film OD vs. Dose calibration file is created by fitting the EDW dose image. By visual inspection, the accuracy of the fitting function can be evaluated.
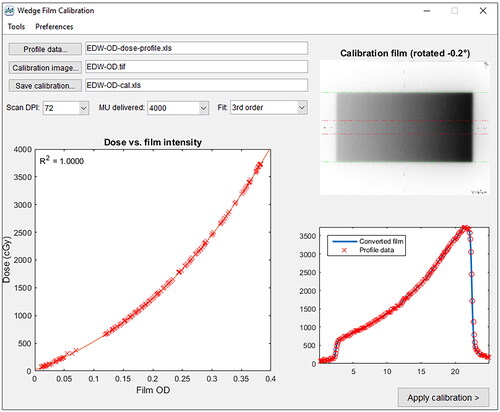
Figure 2. the setup of the EBT-XD film for the PDD method. (a) the position of the film and orientation of the phantom. (b) the setup for radiation Delivery.
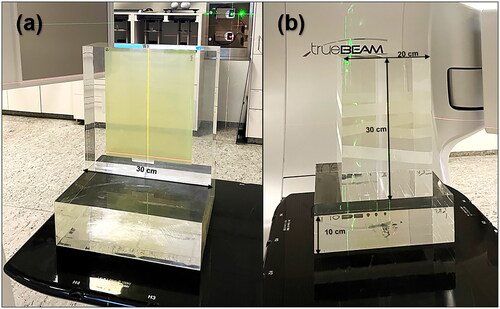
Figure 3. Phantoms used for patient QA. (a) MVP phantom assembled for irradiation. (b) Positioning of the film in the Middle of the MVP phantom. (c) The anthropomorphic STEEV phantom with the special film holder.
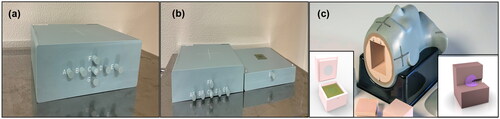
Figure 4. the plot of the Relative OD response over 30 scans. The average OD reading for all scans was levelled as 100% in the graph. The standard deviation was calculated for each scan.
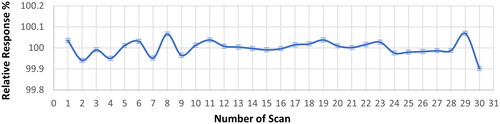
Figure 5. EBT-XD Film calibration curves using manual, EDW and PDD methods. Ten, 201 and 303 data points from manual, EDW, and PDD calibration methods were collected and fitted with third-order polynomials with the correlation coefficient, i.e., R-squared values being 1.0000, 1.0000 and 0.9994, respectively. Zoomed-in plots for the dose range of 3-10 Gy and above 28 Gy.
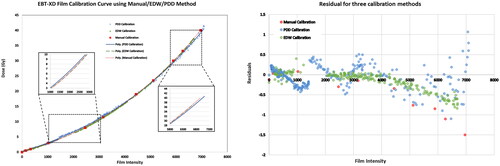
Table 1. The accuracy of EDW and PDD calibration curves was verified. Eight films with known irradiated doses were converted into dose information and compared with actual doses.
Table 2. Gamma passing rate with various criteria, dose converted using three calibration approaches.
Data availability statement
The data that support the findings of this study are openly available in Harvard Dataverse at https://doi.org/10.7910/DVN/RN3IC5.