
Figures & data
Table 1. Patient and treatment characteristics.
Figure 1. Box plots for mean doses for body outline, bowel bag, bladder, spinal cord, duodenum, kidney left, kidney right, pancreas and stomach. IMPT (red), IMRT (blue), VMAT (green). Box plots define the interquartile range (IQR) with the 25th and 75th percentile as top and bottom. The whisker length is defined as 1.5 times the IQR and outliers beyond are marked (Black).
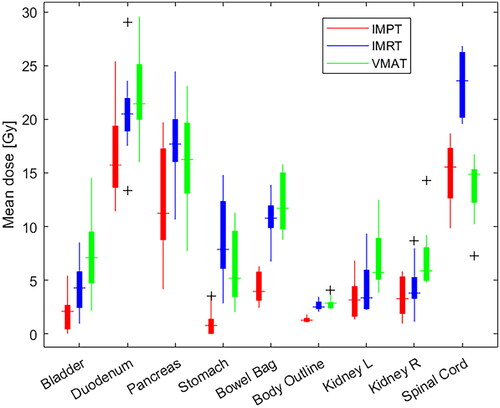
Figure 2. Dose distribution for CTV-E shown for IMRT, VMAT and IMPT. Top row: Transversal view; Middle row: Sagittal view; Bottom row: Coronal view. Shown is the 50% dose colour wash.
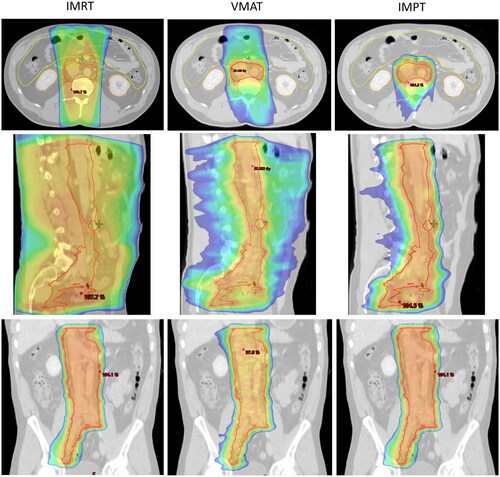
Table 2. Results - Median (range) Dmean and median (range) relative EAR.
Figure 3. Top row: The excess absolute risk (EAR) per 10.000 persons per year of secondary cancer for IMPT (Red), IMRT (blue) and VMAT (green), respectively, according to Schneider et al. [Citation17]. Bottom row: The relative EAR for IMPT vs IMRT (blue) and IMPT vs VMAT (green). Bladder, duodenum, pancreas, stomach, spinal cord, bowel bag (small intestine), bowel bag (colon), and body outline. Box plots define the interquartile range (IQR) with the 25th and 75th percentile as top and bottom. The whisker length is defined as 1.5 times the IQR and outliers beyond are marked (Black).
![Figure 3. Top row: The excess absolute risk (EAR) per 10.000 persons per year of secondary cancer for IMPT (Red), IMRT (blue) and VMAT (green), respectively, according to Schneider et al. [Citation17]. Bottom row: The relative EAR for IMPT vs IMRT (blue) and IMPT vs VMAT (green). Bladder, duodenum, pancreas, stomach, spinal cord, bowel bag (small intestine), bowel bag (colon), and body outline. Box plots define the interquartile range (IQR) with the 25th and 75th percentile as top and bottom. The whisker length is defined as 1.5 times the IQR and outliers beyond are marked (Black).](/cms/asset/96519b3c-c427-4536-9730-0baf3bf05a69/ionc_a_2254925_f0003_c.jpg)
Supplemental Material
Download MS Word (853.7 KB)Data availability statement
Due to the national legislation it is not possible to share data.