
Figures & data
Figure 1. Adaptive treatment and subsequent data collection workflow.
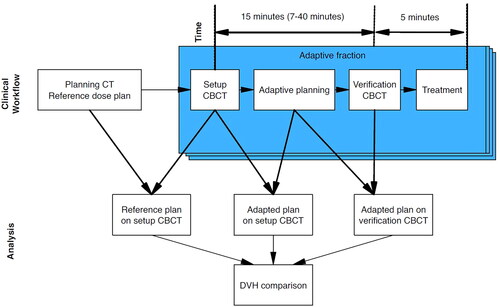
Table 1. Patient demographics.
Figure 2. Distribution of chosen adapted plans for patient 1–20. Reasons for not choosing an adapted plan is also shown for each patient. Patient 1 was the pilot patient and was only treated with the adaptive workflow for the last 8 fractions. Patient 1–3 wasn't included in the daily registration and reasons are therefore unknown.
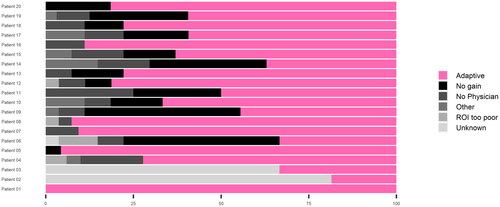
Figure 3. Example of vulvar carcinoma patient with anatomical change due to lymphocele and the direct consequence in dose coverage. A) Reference plan, B) Daily CBCT using scheduled plan, C) Daily CBCT using adapted plan. Isodose levels 95%, 90%, 80% and 50% are visualized. CTV and PTV contours are shown in pink and blue, respectively.
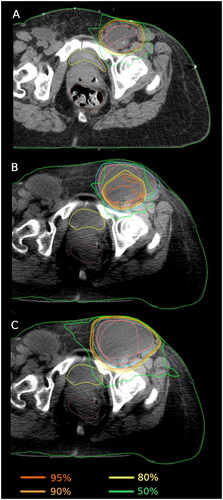
Figure 4. Normalized dose to reference plan for scheduled plans, adapted plans and verification plans for bladder (mean dose), rectum (mean dose), CTV (D95%) & PTV (D95%) respectively for patients 1–20. Dashed lines indicate reference dose. The figure excludes 2 upper outliers on bladder scheduled and adapted, 1 upper outlier on bladder verification, 1 upper outlier on rectum adapted and verification, and 2 and 3 lower outliers on CTV and PTV scheduled respectively, to improve visualization.
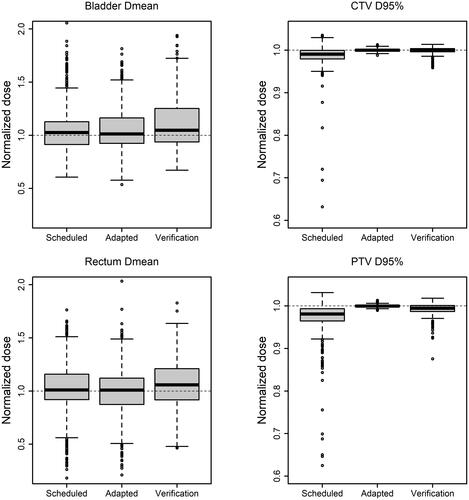
Table 2. Average CBCT slice edits [%] (and range) of bladder, rectum, and CTV contour for patient 4-20.
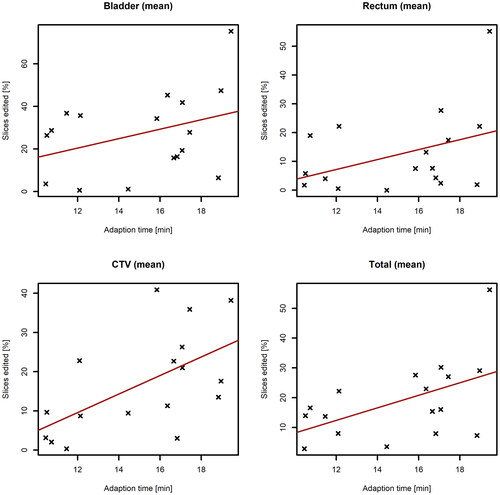
Figure 5. Correlation between proportion of recontoured slices and the time for adaptation for patient 4–20. Each data point represents mean number of slices needed recontouring (bladder, rectum, CTV or total) for each patient. Red lines describe linear fit.
Supplemental Material
Download MS Word (266.3 KB)Data availability statement
Corresponding author can be contacted for access to data and will provide data upon reasonable request. However, this requires that the ethical and data protection regulations allow sharing of the requested data.