
Figures & data
Figure 1. Flow chart showing the inclusion process of personnel and cancer patients.
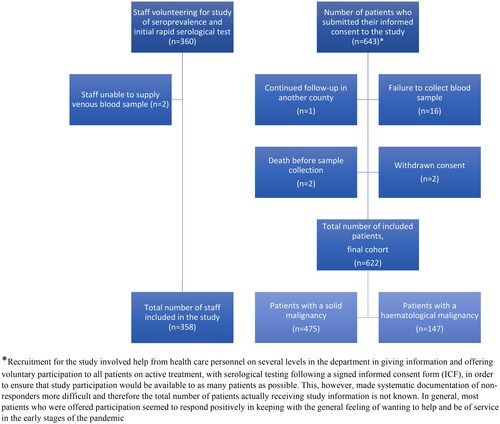
Figure 2. Description of method; study inclusion, collection of blood samples, serological analysis and statistical analysis.
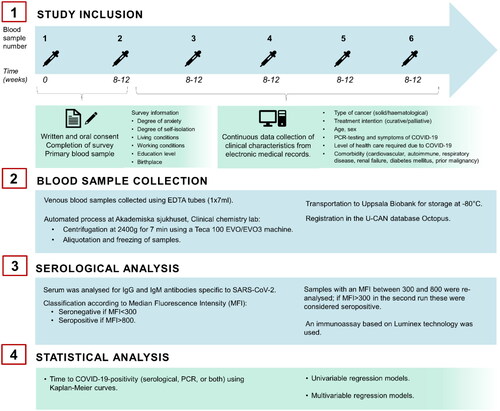
Table 1. Clinical characteristics of 358 staff and 622 cancer patients included in the study, stratified by solid malignancy vs. hematological malignancy.
Figure 3. Patients with hematological malignancies (HM, red line) and patients with solid malignancies (SM, green line) had a lower degree of SARS-CoV-2 seropositivity than health care personnel (blue line) (logrank test p = 0.082).
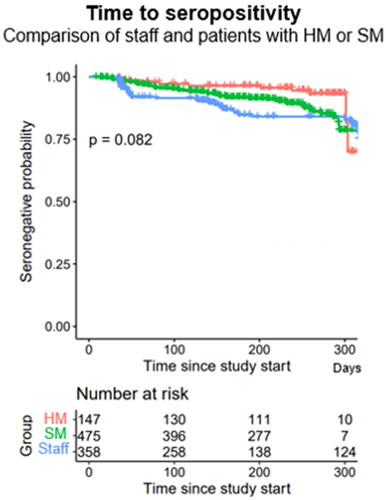
Table 2. Degree of anxiety vs. isolation and seropositivity, PCR-positivity and COVID-19-positivity in staff and patients; stratified by solid malignancy vs. hematological malignancy.
Table 3. Risk of seropositivity associated with degree of self-isolation gender, age, type of malignancy, treatment intention and place of birth.
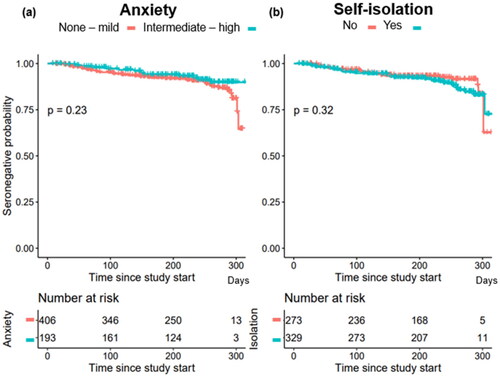
Figure 4. Risk of seropositivity for SARS-Cov-2 depending on degree of anxiety vs. degree of self-isolation. (a) a higher degree of anxiety did not affect the risk of SARS-CoV-2- seropositivity (p = 0.23). (b) Self-isolation did not affect the risk of SARS-CoV-2- seropositivity (p = 0.32).
Supplemental Material
Download MS Word (789.1 KB)Data availability statement
The data generated during the current study are not publicly available due to regulations on personal data protection but are available from the corresponding author on reasonable request.