
Figures & data
Figure 1. Forest plots illustrating hazard ratios (HR) and corresponding 95% confidence intervals (CI) for the risk of Gastrointestinal cancers across different age groups, considering both sexes combined (a), men (B), and women (C). each plot demonstrates the effect of a 5 kg/m2 increase in body-mass index (BMI) on cancer risk, with BMI modelled as a linear variable. The number of cancer cases are indicated within brackets. Age 16-29 was at time of BMI measurement.
▪ Both sexes.
• Men.
♦ Women.
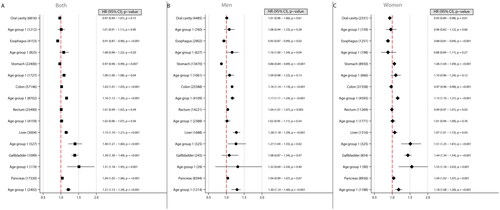
Figure 2. Forest plots illustrating hazard ratios (HR) and corresponding 95% confidence intervals (CI) for the risk of Gender specific cancers across different age groups. The plot demonstrates the effect of a 5 kg/m2 increase in body-mass index (BMI) on cancer risk, with BMI modelled as a linear variable. The number of cancer cases are indicated within brackets. Age 16-29 was at time of BMI measurement.
• Men.
♦ Women.
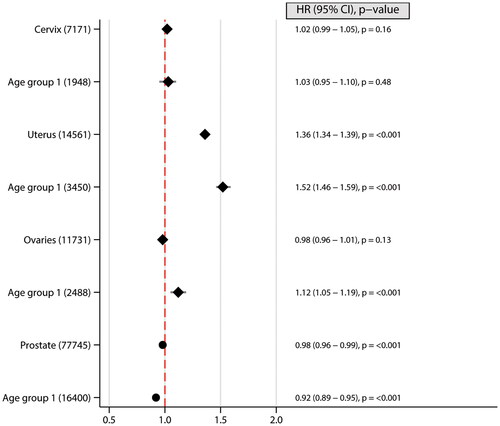
Figure 3. Forest plots illustrating hazard ratios (HR) and corresponding 95% confidence intervals (CI) for the risk of other cancers across different age groups, considering both sexes combined (A), men (B), and women (C). Each plot demonstrates the effect of a 5 kg/m2 increase in body-mass index (BMI) on cancer risk, with BMI modelled as a linear variable. The number of cancer cases are indicated within brackets. Age 16–29 was at time of BMI measurement.
▪ Both sexes.
• Men.
♦ Women.
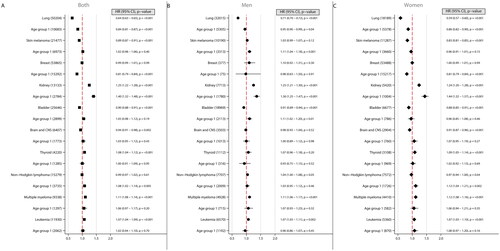
Table 1. Characteristics of the study cohort from the Norwegian tuberculosis screening program 1963–1975.
Supplemental Material
Download MS Word (18.8 KB)Supplemental Material
Download PDF (70.2 KB)Data availability statement
Aggregated anonymous data may be available upon request and approval of Regional Committees for Medical and Health Research Ethics.