
Figures & data
Table 1. Baseline characteristics of gastric cancer patients diagnosed in 2000–2008 and 2009–2016 in Finland (n = 9223).
Table 2. Surgical and other oncological treatments for gastric cancer among patients diagnosed in 2000–2008 and 2009–2016 (n = 9223).
Figure 1. Kaplan–Meier for overall survival of gastric cancer patients in Finland among the following treatment groups: (A) gastric surgery, (B) diagnostic surgery/nonresectable, and (C) no surgery, comparing the time periods 2000–2008 and 2009–2016. The Bonferroni correction was used to adjust the log-rank test p values.
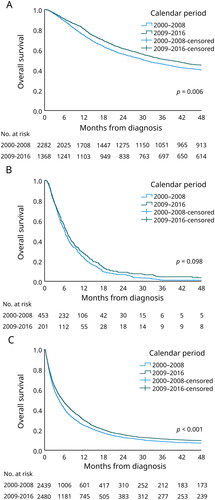
Table 3. Overall survival among gastric cancer patients diagnosed in 2000–2008 and 2009–2016 stratified by (A) surgery and other oncological treatment and (B) stage (n = 9223).
Table 4. Cox regression analysis of the risk of death among patients who underwent gastric surgery. A hazard Ratio (HR) > 1 indicates a higher risk of death (n = 2482)a.
Supplemental Material
Download MS Word (173.3 KB)Supplemental Material
Download MS Word (23.3 KB)Data availability statement
Due to legal restrictions, the data underlying this study cannot be shared.