
Figures & data
Figure 1. Primary tumor position of the four patients, for which the suggested method was tested (top row images) and summary of lesion and PTV characteristics (below). PTV margins were population based [Citation10], however, individually modified for patient #1 due to large tumor deviation between DIBHs.
![Figure 1. Primary tumor position of the four patients, for which the suggested method was tested (top row images) and summary of lesion and PTV characteristics (below). PTV margins were population based [Citation10], however, individually modified for patient #1 due to large tumor deviation between DIBHs.](/cms/asset/d8df4f35-c8d7-4b11-b4d4-1fbc06a7156b/ionc_a_2259084_f0001_c.jpg)
Figure 2. Workflow for the intra-fractional robustness evaluation of DIBH RT.
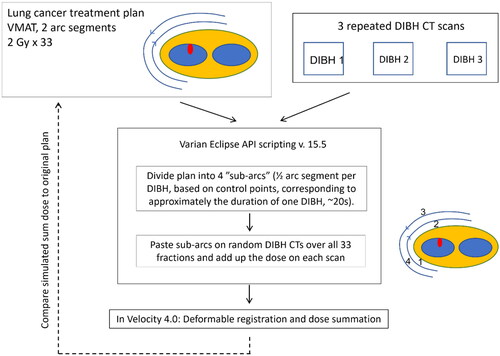
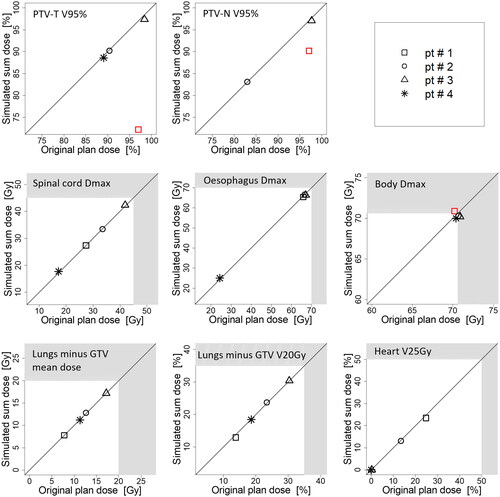
Figure 3. Dosimetric comparison of the original plan (x-axis) and the simulated sum dose (y-axis), representing an estimate of the dosimetric effect of anatomical differences between consecutive DIBHs. The shaded areas represent the values where planning constraints for OARs are not met. Each patient is represented by his/her own symbol. If planning constraints are met in the original plan, but not in the simulated sum dose, symbols are marked as red. Note that patient #4 has a T-site lesion only and is therefore not presented on the PTV-N plot.
Supplemental Material
Download MS Word (1.3 MB)Data availability statement
Data not available due to ethical/legal restrictions.