
Figures & data
Table 1. Baseline characteristics at the time of SRS.
Table 2. Radiotherapy characteristics at time of SRS.
Figure 1. Kaplan–Meier Curves for OS by (a) receptor profiles, (b) HER2 status, (c) lines of treatment dichotomized at the median (four lines), and (d) presence of extracranial visceral metastases yes/no.
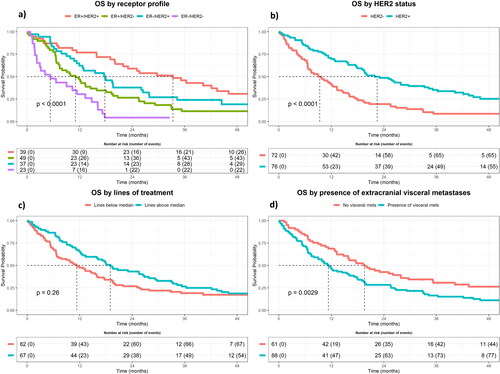
Table 3. Univariate and multivariate Cox regression analysis for OS.
Figure 2. Cumulative incidence for CNS-PFS illustrated for the entire cohort.
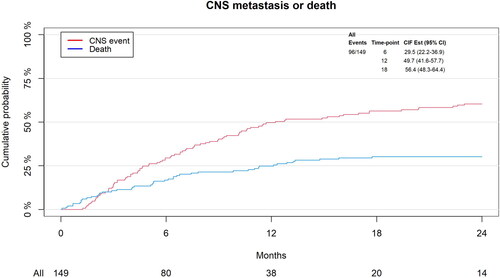
Figure 3. Cumulative incidence for CNS-PFS illustrated by presence of extracranial visceral metastases Yes/no.
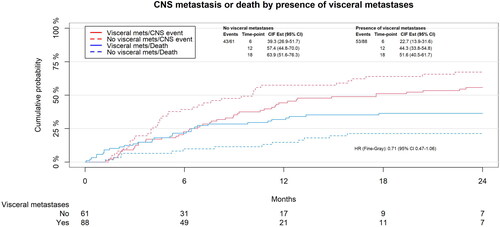
Table 4. Univariate and multivariate Fine-Gray regression analysis for CNS-PF.
Data availability statement
The data supporting the findings of this study are not publicly available due to institutional restrictions. The data can be made available to qualified researchers through application to the Danish Breast Cancer Group.