Figures & data
Figure 1. Description of the strategy used for comparing photon RT to proton RT for HNCUP patients. The gross tumour volume (GTV) is shown in red and the elective target in orange. Selected OAR are the extended oral cavity (pink), the spinal cord (green) and the carotid arteries (brown). for bilateral disease, the treated targets were used, but OAR were adjusted to current guidelines. For cases with only unilateral nodal disease, the targets were adjusted by deleting mCTV and the contralateral nCTV and subsequently a fictitious, but probable, recurring primary were delineating and the carotid arteries were added as an OAR.
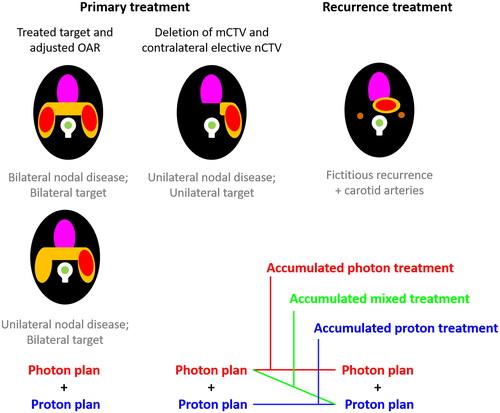
Figure 2. Top: Boxplot comparisons of the mean doses to OAR for a subset of ten patients with simulated bilateral photon- (red) and proton treatment plans (blue). Middle: Boxplot comparison of the mean OAR doses for a subset of eight patients with either a bilateral- (red) or unilateral (black) target treated with photon RT. Bottom: Boxplot comparison of the mean OAR doses for a subset of ten patients with simulated unilateral photon- (red) and proton treatment plans (blue). statistically significant differences are marked with an asterisk.
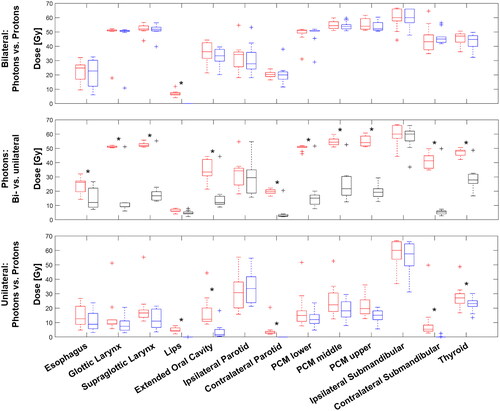
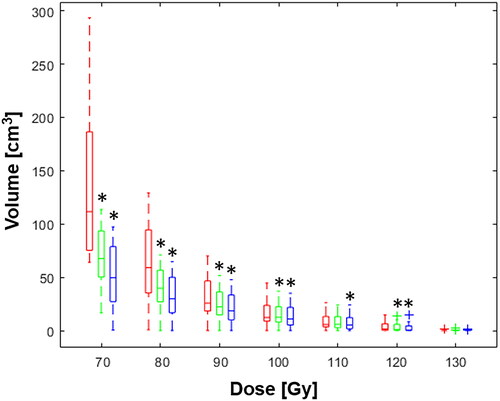
Figure 3. Boxplot of the volumes receiving an accumulated dose between 70 Gy and 130 Gy. Photon + photon treatment is shown in red, photon + proton treatment in green, and proton + proton treatment in blue. Statistical significant differences to the photon + photon treatment are marked with asterisks.