
Figures & data
Table 1. Patient population, target volumes. PTVn is a common term for LNs to 55 and 57.5 Gy, it is the total PTVn if multiple nodes are present.
Figure 1. Flowchart of the script-based planning process. EUD: equivalent uniform dose.
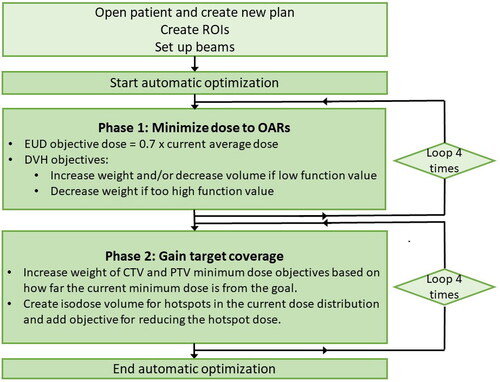
Table 2. Dose statistics for target volumes. CTVn and PTVn are common terms for lymph nodes to 55 and 57.5 Gy. All values are normalized to prescribed dose levels (45, 55 and 57.5 Gy). is defined as dose to 0.1 % volume and
is defined as dose to 99.9% volume. For patients with SIB, maximum doses are given in regions 10 mm outside PTVn. The
isodose was cropped to exclude isodose volumes closer than 30 mm to another target volume with an equal or higher prescribed dose. Diff. refers to the median of the pairwise differences between the automatic and clinical plans (Diff.
0 if automatic
clinical). Corresponding mean values are given in Appendix B.
Figure 2. Average DVHs for OARs. Number of patients (n) are given for each OAR.
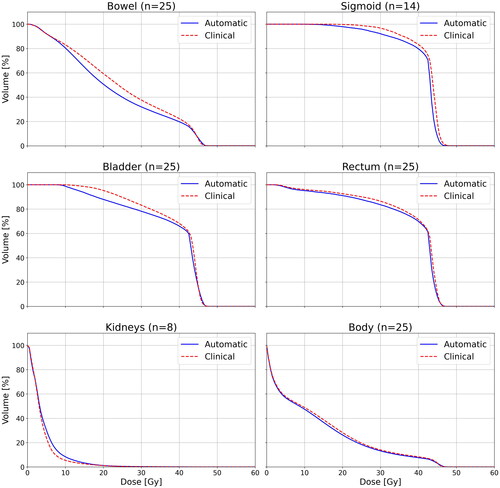
Table 3. Dose statistics for OARs. For patients with positive LNs, maximum doses are given in regions 15 mm outside PTVn. is defined as dose to 0.1
of the volume, except for body where
is dose to 0.03
of the volume. All maximum doses (%) are normalized to 45 Gy. Diff. refers to the median of the pairwise differences between the automatic and clinical plans (Diff.
0 if automatic
clinical). Corresponding mean values are given in Appendix B.
Figure 3. Preferred plans in the blinded comparison between the automatic and clinical plans for all 25 patients. The number of LNs and dose prescriptions level for each patient are reported.
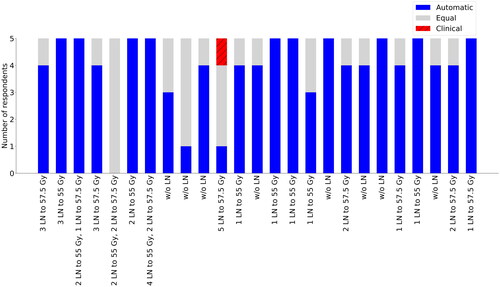
Figure 4. Automatic vs. clinical plans for two different representative patients in (a), (b) and (c), (d). Isodose lines are dark yellow for 55 Gy, dark green for 49.5 Gy, orange for 47.3 Gy, yellow for 45 Gy, green for 42.75 Gy, white for 27.5 Gy, and sea green for 16.5 Gy. PTV is outlined in blue, CTV in pink and GTV in red. The bowel is dark green, the sigmoid is orange, and the rectum is brown.
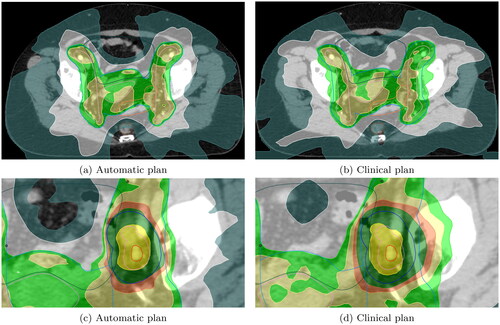
Table 4. Number of MU, gamma passing rate (3%/3 mm) with 20%–500% local dose, and maximum gamma-index.
Table A1. Dose constraints used in this study. Adapted from national guidelines and the EMBRACE II study [Citation32, Citation34]. CTVn/PTVn is a common term for lymph nodes to 55 and 57.5 Gy. All values are normalized to the prescribed dose level (45, 55, and 57.5 Gy). = dose to 0.1
of the volume, except for body where
= dose to 0.03
of the volume. All maximum doses to OARs (%) are normalized to 45 Gy.
Table B1. Dose statistics for target volumes. CTVn/PTVn is a common term for lymph nodes to 55 and 57.5 Gy. All values are normalized to prescribed dose levels (45, 55, and 57.5 Gy). is defined as dose to 0.03
volume and
is defined as dose to 99.9% volume. The
isodose was cropped to exclude isodose volumes closer than 30 mm to another target volume with an equal or higher prescribed dose. Diff. refers to the mean pairwise differences between the automatic and clinical plans (Diff.
0 if automatic
clinical).
Table B2. Dose statistics for OARs. For patients with positive LNs, maximum doses are given in regions 15 mm outside PTVn. is defined as dose to 0.1
of the volume, except for body where
is dose to 0.03
of the volume. All maximum doses (%) are normalized to 45 Gy. Diff. refers to the mean pairwise differences between the automatic and clinical plans (Diff.
0 if automatic
clinical).
Supplemental Material
Download MS Word (22.8 KB)Data availability statement
Raw data were generated at St Olavs Hospital, Norway. Derived data supporting the findings of this study are available from the corresponding author MF on request.