
Figures & data
Figure 1. The gating surrogates. Tracking Accessory 3 (A) and the gating block (B) for the Truebeam™ gating system. The two pieces of carbon fibre for tracking Accessory 3 are attached behind the lower left reflector and the arrows indicate the lines used for aligning.
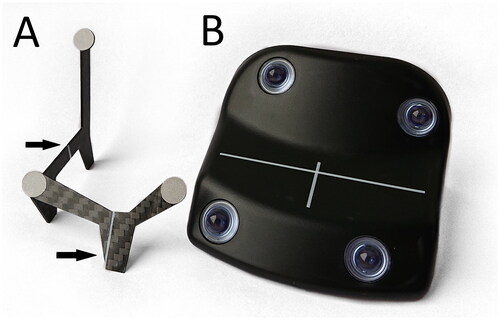
Figure 2. Relative dose measured under the TA3 and GB exposed to a 15 x 15 cm2 field of 6 MV photons. (A) Film profiles measured at the surface directly under the TA3 and GB as well as a profile with no surrogate (NS) present. (B,C) 2D dose directly below the GB and TA3, respectively, where the lines represent the position of the respective profiles shown in (a), the ‘x’ in the images represents where the depth dose curves in were measured. (D,E) Profiles at depths 0 mm, 2 mm, and 5 mm for TA3 and GB.
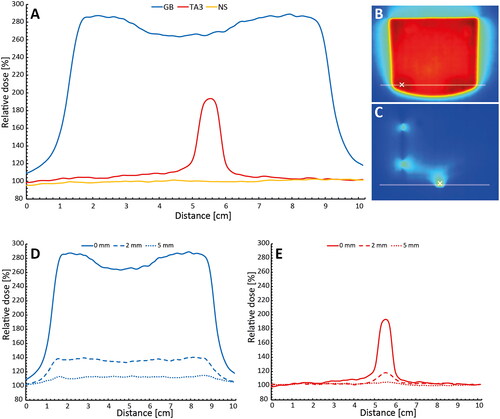
Figure 3. Smoothed percentage depth dose curves below the surrogates and with no surrogate (NS). The points of measurement were indicated in for the GB and TA3, respectively. The corresponding water equivalent thickness determined by shift in depth of maximum dose was 1 mm and 3 mm for the TA3 and the GB, respectively.
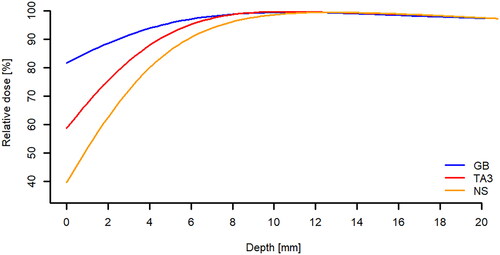
Table 1. Mean amplitudes and range for phantom displacements in vertical, longitudinal and lateral with respect to isocenter.
Table 2. Mean amplitudes and range for phantom rotations in yaw, pitch and roll.
Data availability statement
The data that support the findings of this study are available from the corresponding author, SMSD, upon reasonable request.