
Figures & data
Table 1. To pinpoint areas where the DLS models underperformed, a checklist with a set of phrases was used to describe deviations from guidelines.
Figure 1. Evaluation scores for CTVs (A) and organs at risk (B), respectively. Each volume was reviewed and evaluated based on how well they followed consensus guidelines and given a score on a scale from 0 – 3, describing if the volume was not usable (score 0), usable with major corrections (score 1), usable with minor corrections (score 2) or if the structure could be used without corrections (score 3).
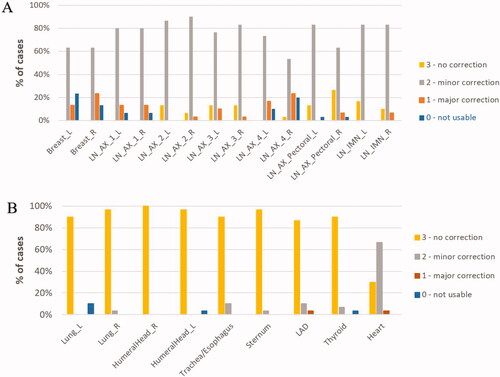
Table 2. The left column show the time recorded for manual delineations according to ESTRO guideline for breast volumes and all lymph node levels summed (level 1–4, interpectoralis and internal mammary chain delineated individually) as well as the heart averaged over all 30 patients.
Table 3. The table shows the recorded time to manually delineate OARs by the radiation therapist, averaged across all 30 patient.
Figure 2. Similarity indices comparing manual contours to uncorrected DLS- generated volumes. Dice Similarity Coefficient (A) and 95th percentile Hausdorff distance (B) are shown for all target volumes, together with lungs and heart. Median values are marked with a line, average values are marked with a cross, 1st and 3rd quartile are marked in the boxplot, and outliers are shown as dots. Average volumes for each contour are denoted above the boxplot.
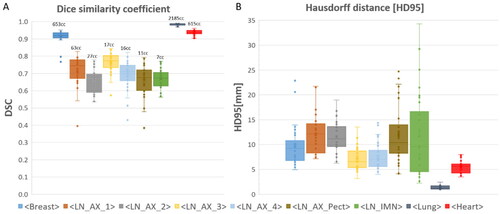
Figure 3. Examples of deviations from guidelines by using the DLS model to generate breast (left) and axillary lymph node level 4 (middle and right). Uncorrected model generated volumes are shown in red, reference volumes (manual delineations) are shown in dark green and corrected DLS volumes are shown in bright green. The example shows a DLS generated breast that is incomplete/speckled cranially (P1) and a DLS generated axillary lymph node level 4 that is incompletely outlined cranially and caudally (P1/P4).
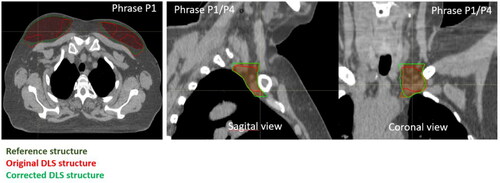
Figure 4. Examples of typical deviations from consensus guidelines. The upper left example shows a DLS generated level 1 axillary lymph node contour (white) that does not take into account caput humeri PRV (the volumes overlap) (P5). The upper right example shown a DLS generated level 4 axillary lymph node contour (pink) and the corresponding manually outlined contour (brown). The DLS generated contour starts too late relative to visible vasculature (P6). The lower left example shows a DLS generated level 4 axillar lymph node (yellow) where the jugular vein is not included (P8). The lower right example illustrates a DLS generated breast tissue (blue) that is contoured into musculature and/or rib and/or chest wall (P11).
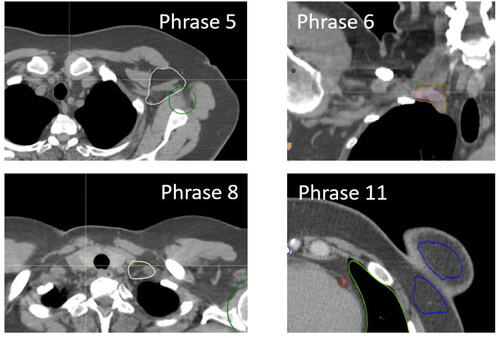
Table 4. The most frequently used phrases for the DLS generated CTVs that received a score of 2.
Figure 5. Dose coverage to the manually delineated CTVs (A) or PTVs (B) following a treatment plan generation and dose optimization using the uncorrected DLS generated CTVs for 10 patients. Adequate dose coverage was defined as a D98 value greater than 95% (38.05 Gy) and 90% (36.05 Gy) of the prescribed dose for the CTVs and PTVs, respectively (marked with a line).

Table 5. Dosimetric parameters for uncorrected DLS model structures and manual delineations. Statistically significant differences are marked by an asterisk (p < 0.05, using a paired difference t-test). All treatment plans were optimized to achieve a homogeneous dose to the uncorrected DLS CTVs of 40.05 Gy.
Supplemental Material
Download MS Word (82.1 KB)Data availability statement
The participants of this study did not give written consent for their data to be shared publicly, so due to the sensitive nature of the research supporting data is not available.