
Figures & data
Figure 1. Illustration of the pathological sectioning. This figure illustrates the pathological sectioning of the tumor specimen. The red lines indicate the locations of biopsies taken from block 1 (central), block 2 (semi-peripheral), and block 3 (peripheral). The top panels depict the specimen, with the black contour delineating the tumor tissue and the area where biopsies for genetic analyses were performed. Distances between the biopsies are indicated for reference.
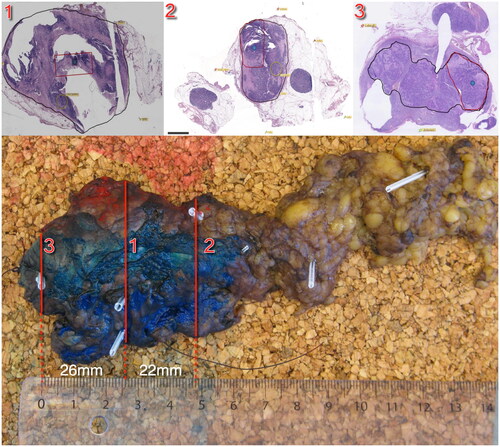
Table 1. Patient characteristics.
Figure 2. Illustration of SCNAs detected in 45 preselected genes in biopsies from the 33 tumors. The Y-axis depicts the 45 preselected genes and the X-axis depicts the biopsies grouped and ordered by patient number. At the bottom, sample numbers are visible. The three entries for each tumor correspond to the three biopsy positions: the central biopsy is labeled as 1, the semi-peripheral biopsy as 2, and the peripheral biopsy as 3. Primary tumors and lymph node metastases are indicated with P and L respectively. The color bar to the right displays the actual aberration in the specific gene. Abbreviations. A: amplification; D: deletion; LOH: loss of heterozygosity; NO: none observed. The genes above the dashed horizontal line correspond to and the results marked with a circle indicate clinically relevant heterogeneity in genes in as well.
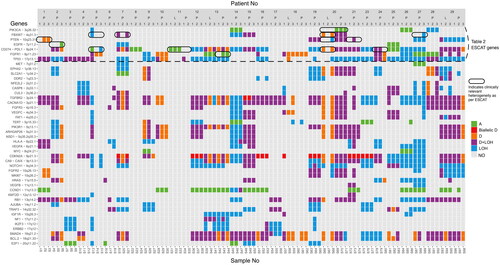
Figure 3. Sinaplots and boxplots illustrate differences in numbers of SCNAs. The Y-axis depicts the number of SCNAs and the X-axis depicts the biopsy location (left panel) or the primary versus recurrent disease (right panel). Each dot in both panels represents one of the biopsies. The left panel depicts the number of SCNA in a biopsy, grouped by the biopsy location in the tumor (central, semi-peripheral, and peripheral). The right panel depicts the number of SCNA in a biopsy, grouped by new primary and recurrent disease.
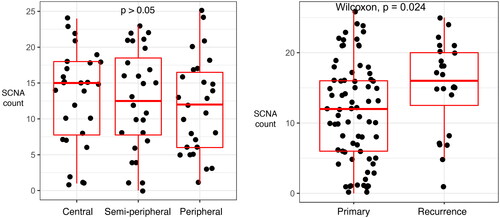
Figure 4. Illustration of the type of change in SCNAs between the three biopsies. The Y-axis depicts the 45 preselected genes and the X-axis depicts biopsies from primary tumors grouped by biopsy location (central and semi-peripheral; central and peripheral; semi-peripheral and peripheral). At the bottom, sample numbers are visible. Left: the differences between central and semi-peripheral biopsies amount to 6 changed aberrations, 36 lost aberrations, and 27 new aberrations. Middle: the differences between central and peripheral biopsies: 11 changed, 68 lost, and 23 new aberrations. Right: the differences between semi-peripheral and peripheral biopsies: 12 changed, 62 lost, and 26 new aberrations. The color bar to the right depicts the type of aberration. Abbreviations. A: amplification; D: deletion; LOH: loss of heterozygosity; NO: none observed.
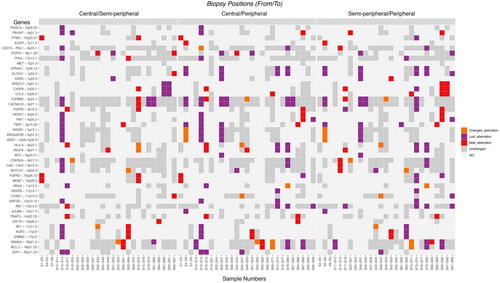
Table 2. ESCAT score of assessable SCNAs and hotspot mutations with relevant findings in the current population.
Table 3. The 10 tumors with heterogeneity in SCNAs and hotspot mutations with potential clinical relevance and the implications for therapy.
Supplemental Material
Download MS Word (12.1 KB)Supplemental Material
Download PDF (83 KB)Supplemental Material
Download PDF (389.3 KB)Supplemental Material
Download MS Word (19.4 KB)Supplemental Material
Download MS Word (20.5 KB)Data availability statement
The data set used and analyzed during the study is available from the corresponding author upon reasonable request.