
Figures & data
Table 1. Municipal autonomous taxation powers
Figure 1. The development of total municipal debt and municipal average income tax rate, 2000–2019
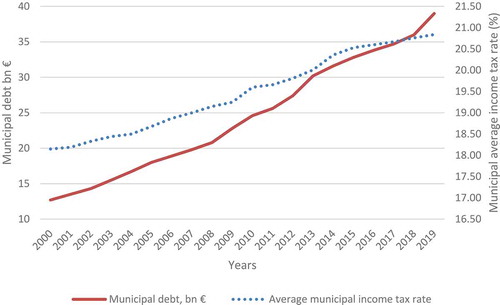
Table 2. Proposed and implemented regionalisation reforms as a response to the ageing society and related developments
Table 3. Development of the number of municipalities, average population size of municipalities, voter turnout in municipal elections, share of urban municipalities, and number of joint municipal authorities between 1972 and 2017 (Statistics Finland Citation2020; The association of finnish local and regional authorities Citation2020)
Table 4. Municipalities classified by the size of the old people’s group and some averages of financial variables of year 2019. (Source: Statistics Finland and the association of Finnish regional and local authorities, elaborated by the authors)
Table 5. Municipalities classified by the size of the old people’s group and some averages of current costs per inhabitant of year 2019. (Source: Statistics Finland and the association of Finnish regional and local authorities, elaborated by the authors)
Table 6. Municipalities classified by the size of the old people’s share and some averages of demographic variables of year 2019. (Source: Statistics Finland and the association of Finnish regional and local authorities, elaborated by the authors)
Table 7. Municipalities classified by the size of the old people’s group, tax income and grant income of year 2019. (Source: Statistics Finland and the association of Finnish regional and local authorities, elaborated by the authors)
Table 8. Correlations between grant income per inhabitant and other variables
Table 9. Regression model (ordinary least squares) of the dependent variable of combined tax and grant income per inhabitant. Data for variables were collected from the 2019 municipal statistics of the association of Finnish local authorities
Table 10. Accrued surplus per inhabitant in municipalities explained with a regression analysis (OLS). Data for variables collected from the 2019 municipal statistics of the association of Finnish local authorities