Figures & data
Table 1. Summary statistics, Israeli municipalities, 2003–2018.
Figure 1. Effective number of council parties by seats (ENCPML).
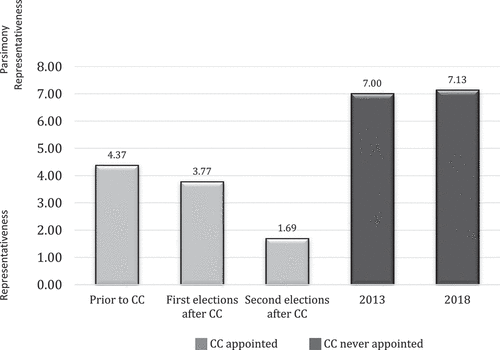
Figure 2. Number of mayoral candidates.
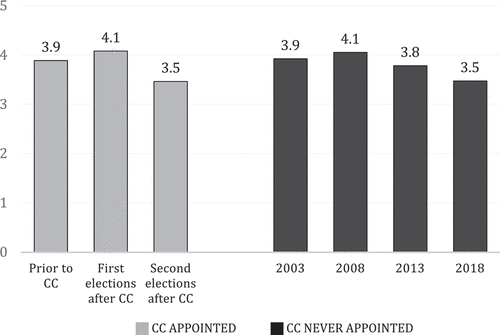
Figure 3. Number of parties running.
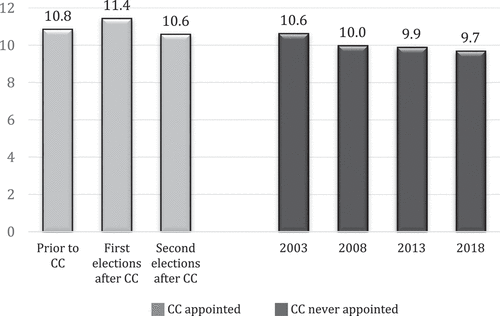
Figure 4. Number of parties that won seats.
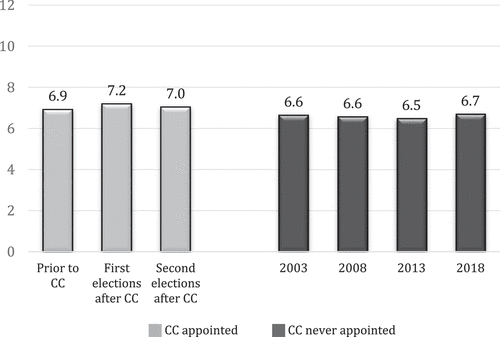
Figure 5. Votes for Mayor.
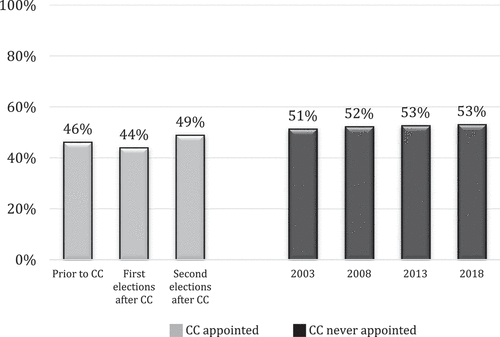
Figure 6. Votes for Mayor’s party.
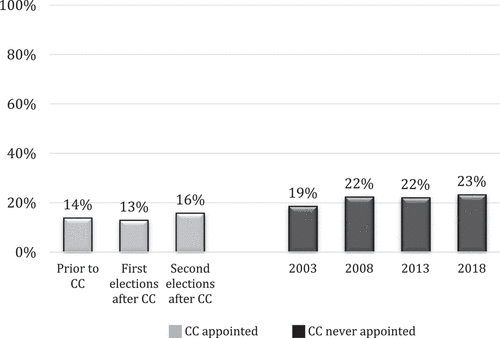
Figure 7. Votes for the largest party.
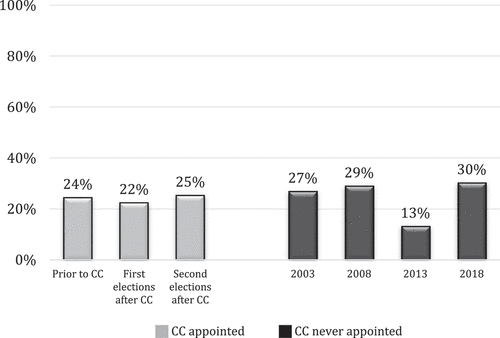
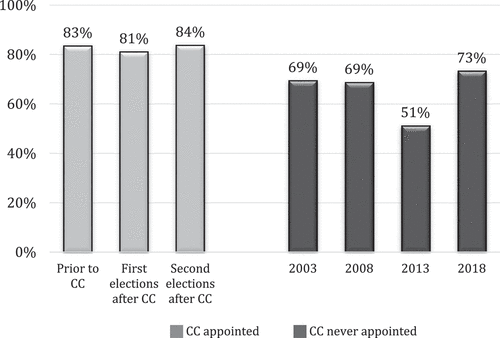
Figure 8. Rates of Mayoral runoff elections.
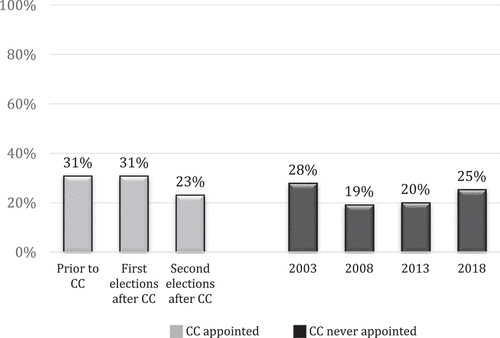
Figure 9. Rates of incumbent Mayors who ran for and won an additional term.
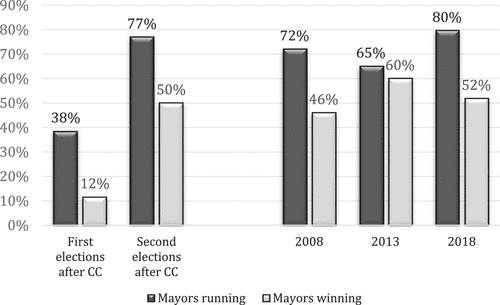
Figure 10. Voter turnout in local elections.