Figures & data
Figure 1. Men and Women councillor’s experiences of incivility and gender abuse over two time periods: during the election campaign and first year in office. Note: Numbers indicate percentage of councillors who report they have experienced a given behaviour at least once during the election campaign/first year in the office. Patterned columns = men; block colored columns = women.
Table 1. Linear Regression Results Predicting Incivility during the Election Campaign and First Year in Office.
Table 2. Linear Regression Results Predicting Incivility with Gender and CALD status.
Table 3. Linear regression results predicting incivility with gender and age.
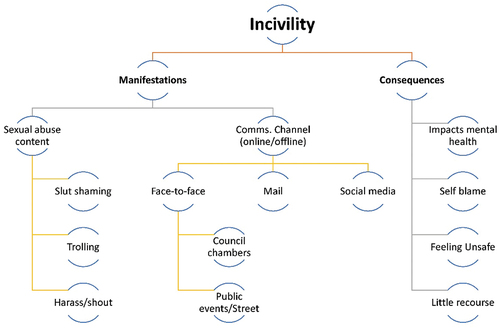
Figure 2. Summary of Interview findings of how younger women experience incivility and gender incivility and its consequences for them.
. Source of incivility for candidates during an election campaign and councillors in their first year in office.