Figures & data
Table 1. Items of the Musical Child Questionnaire.
Figure 1. Comparison of Category Means for child and adult musicality. Ratings for children in black, ratings for adults (from Hallam, Citation2010) in tan. All p-values are results of two-tailed t-tests. *** p < .001. ns = not significant.
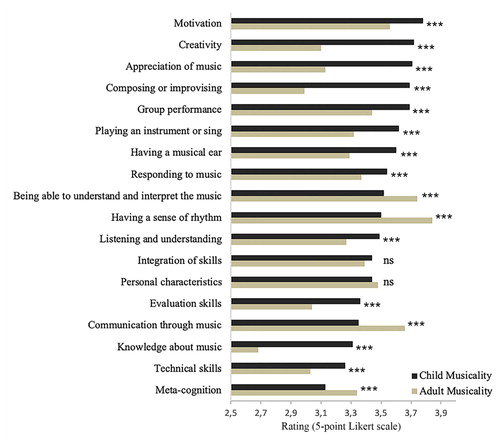
Table 2. Fit indices of computed models.
Table 3. Mean ratings grouped by components.
Table 4. Items of the short scale of the Musical Child Questionnaire with component loadings.
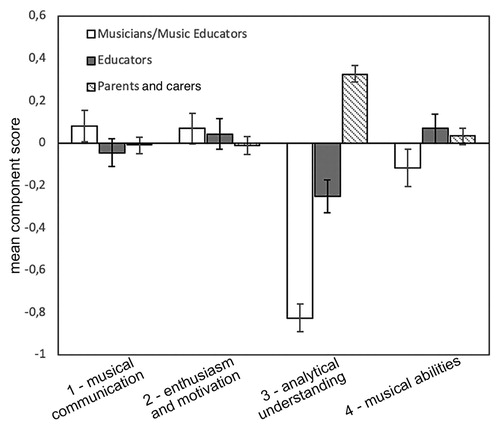
Figure 2. Mean component scores by professional groups. Error bars: standard error of the mean.