Figures & data
Figure 1. Plasma concentration of canagliflozin over 24 hoursCitation14. CANA, canagliflozin; IC, inhibitory concentration; SD, standard deviation; SGLT, sodium glucose co-transporter. *Pharmacokinetic profiles are mean + SD using a free fraction of 1.5%. †IC50 values are mean values from four experiments; IC90 values are assumed to be 9 × IC50 values.
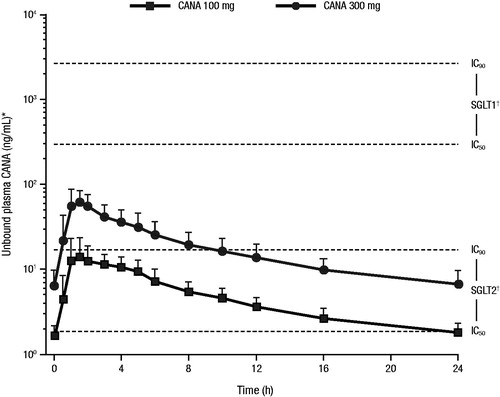
Figure 2. Changes from baseline in (A) serum beta-CTX and (B) serum osteocalcin with canagliflozin at Week 52 (study in older patients)Citation36. beta-CTX, serum collagen type-1 beta-carboxy-telopeptide; PBO, placebo; CANA, canagliflozin; LS, least squares; CI, confidence interval. Republished with permission of the Endocrine Society, from Bilezikian et al.Citation36; permission conveyed through Copyright Clearance Center Inc.
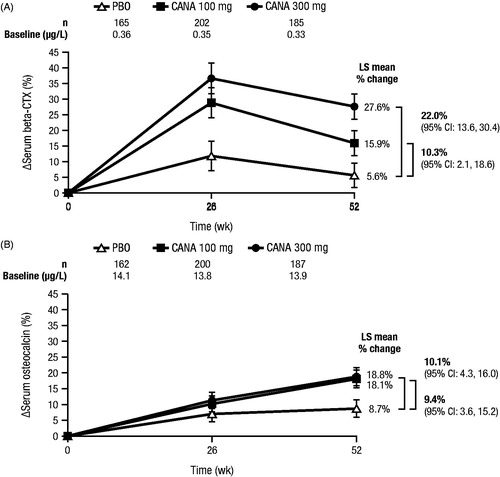
Figure 3. Scatter plot of change in beta-CTX by change in body weight from baseline to Week 52 (study in older patients)Citation36. beta-CTX, collagen type-1 beta-carboxy-telopeptide; BW, body weight; PBO, placebo; CANA, canagliflozin. Republished with permission of the Endocrine Society, from Bilezikian et al.Citation36; permission conveyed through Copyright Clearance Center Inc.
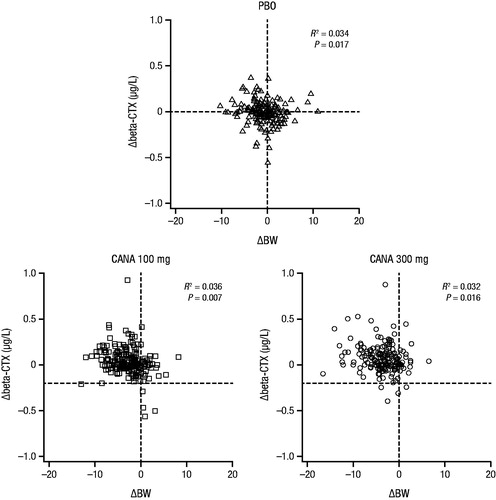
Figure 4. Change from baseline in BMD with canagliflozin at Week 104 (study in older patients)Citation36. BMD, bone mineral density; CI, confidence interval; PBO, placebo; CANA, canagliflozin. *95% CI for the difference versus PBO excludes 0.
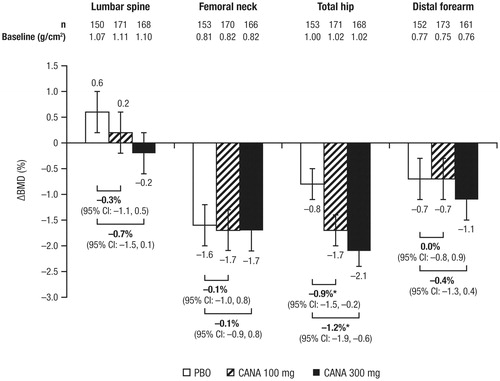
Figure 5. Changes in BMD associated with canagliflozin (study in older patients) and weight-loss interventionsCitation36,Citation44,Citation45. BMD, bone mineral density; PBO, placebo; CANA, canagliflozin; WL, weight loss.
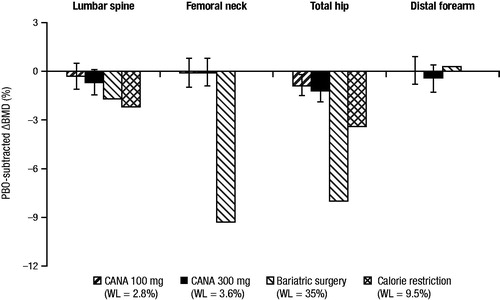
Figure 6. Relationship between weight loss and BMC with canagliflozin treatment (add-on to MET vs GLIM study and study in older patients). BMC, bone mineral content; GLIM, glimepiride; CANA, canagliflozin; PBO, placebo; LS, least squares; CI, confidence interval; MET, metformin.
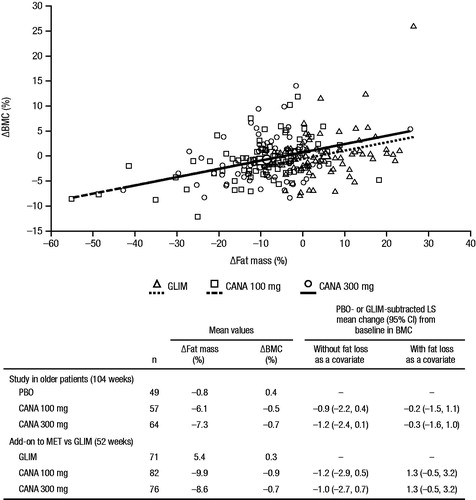
Figure 7. Fracture incidence rate with canagliflozin in the overall population of pooled studies, CANVAS, and pooled non-CANVAS studiesCitation49. CANVAS, CANagliflozin cardioVascular Assessment Study; CANA, canagliflozin; CI, confidence interval. *95% CI for the hazard ratio versus non-CANA excludes 1.
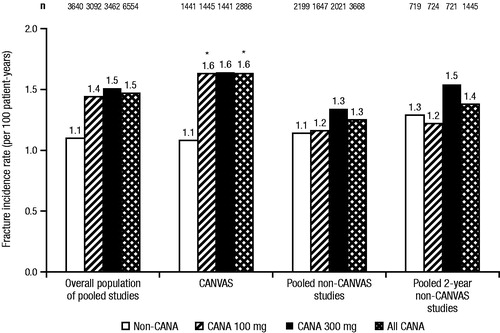
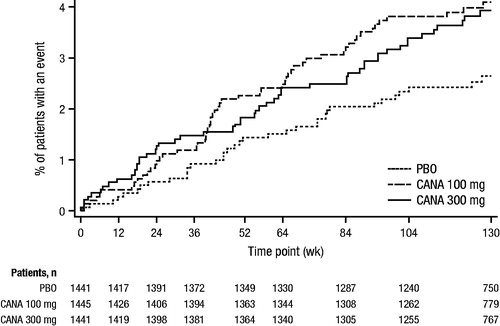
Figure 8. Kaplan-Meier plot of time to first fracture AE with canagliflozin (CANVAS)Citation49. AE, adverse event; CANVAS, CANagliflozin cardioVascular Assessment Study; PBO, placebo; CANA, canagliflozin. Republished with permission of the Endocrine Society, from Watts et al.Citation49; permission conveyed through Copyright Clearance Center Inc.