Figures & data
Table 1. Pre-index characteristics of the HG and non-HG groups.
Figure 1. Comorbidity prevalence during the pre- and post-index periods in (A) the HG group and (B) the non-HG group. White bars, during 1 year pre-index; dark grey bars, during 1 year post-index. (C) Change in comorbidity prevalence from the pre-index to the post-index period in both HG and non-HG groups. White bars, HG group; dark grey bars, non-HG group. *p < 0.05; **p < 0.01; ***p < 0.001; ****p < 0.0001. BI, basal insulin; HG, hypoglycemia. Only the comorbidities that are significant factors in the baseline models are shown. Microvascular disease comprises retinopathy, neuropathy and nephropathy. HG group defined as those experiencing a hypoglycemic event during 1 year following BI initiation (3066/31,035, 9.9%). Non-HG group defined as those who did not experience a hypoglycemic event during 1 year following BI initiation (27,969/31,035, 90.1%).
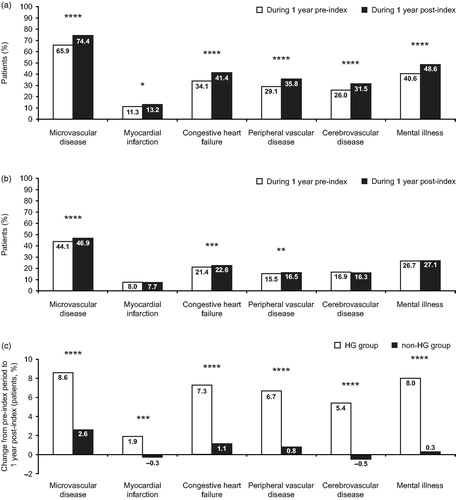
Table 2. Antihyperglycemic medication during the follow-up period.
Figure 2. HR analysis for all-cause hospitalization and death. *Hypoglycemia: indicator of a medically attended hypoglycemic event occurring before hospitalization or death. Endo, endocrinologist.
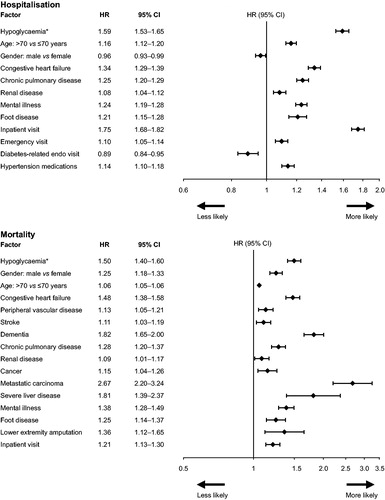
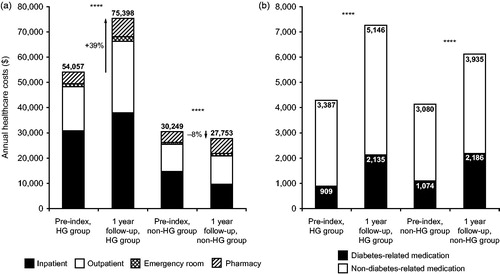
Figure 3. Unadjusted annual treatment costs for the HG group and the non-HG group, during 1 year pre-index and during 1 year follow-up post-BI initiation. (A) Total costs by healthcare setting. Dark grey bars, inpatient; white bars, outpatient; cross-hatched, emergency room; hatched, pharmacy. (B) Pharmacy costs. Black bars, diabetes-related medication; white bars, non-diabetes-related medication. HG group defined as those experiencing a hypoglycemic event during 1 year following BI initiation (3066/31,035, 9.9%). Non-HG group defined as those who did not experience a hypoglycemic event during one year following BI initiation (27,969/31,035, 90.1%). ****p < 0.0001. BI, basal insulin; HG, hypoglycemia; ns, non-significant.