
Figures & data
Figure 1. Patient identification. CF: cystic fibrosis; CFTR: cystic fibrosis transmembrane conductance regulator; FEV1: forced expiratory volume in 1 second; IP: inpatient stay. a300 charts were not abstracted because the physician declined to participate/provide the chart, the chart lacked ≥2 FEV1 measurements in the 18-month observation period, and/or there was evidence in the chart of patient participation in a phase 2/3 CFTR modulator trial.
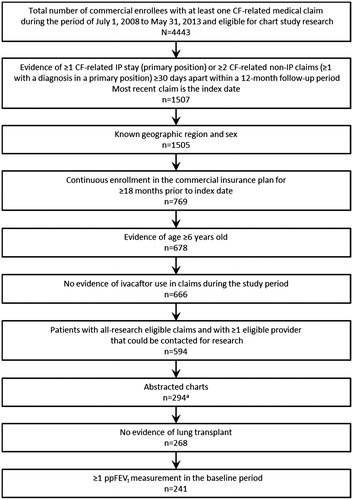
Table 1. Baseline demographic and clinical characteristics.
Table 2. PEx frequency and mean annual PEx-related costs by disease stage during 12-month follow-up.
Figure 2. (A) Mean PEx episode duration (days ± SD) during follow-up. (B) Mean costs per PEx episode during follow-up. IP: inpatient; IV: intravenous; PEx: pulmonary exacerbation.
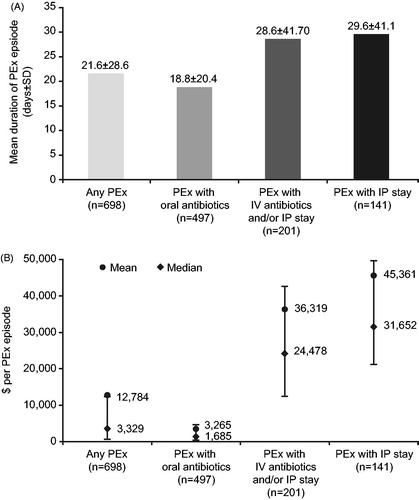
Table 3. Logistic regression models for risk of PEx requiring IV antibiotics and/or IP stay during 12-month follow-up.