
Figures & data
Table 1. Patient demographics.
Table 2. Comorbidities.
Figure 1. Mean distance walked after surgery. *Unadjusted p = .025, adjusted p = .070. Day of surgery: liposomal bupivacaine, n = 62; control, n = 66. POD 1: liposomal bupivacaine, n = 55; control, n = 56. POD 2: liposomal bupivacaine, n = 32; control, n = 32. Day of discharge: liposomal bupivacaine, n = 54; control, n = 41. POD: postoperative day; SD: standard deviation.
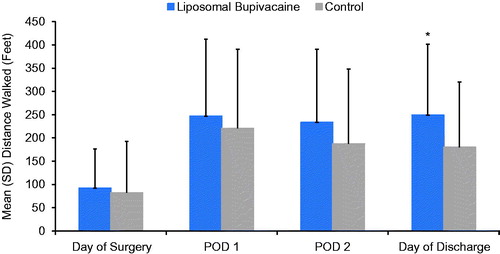
Figure 2. Proportion of patients using opioid rescue. *Unadjusted and adjusted p < .01. Day of surgery: liposomal bupivacaine, n = 32; control, n = 38. POD 1: liposomal bupivacaine, n = 19; control, n = 37. POD 2: liposomal bupivacaine, n = 5; control, n = 20. POD: postoperative day.
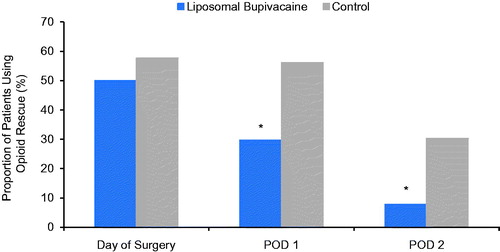
Figure 3. Mean cumulative AUC of the numeric pain score. *Unadjusted and adjusted p < .01. Day of surgery: liposomal bupivacaine, n = 62; control, n = 55. POD 1: liposomal bupivacaine, n = 61; control, n = 62. POD 2: liposomal bupivacaine, n = 35; control, n = 51. AUC: area under the curve; POD: postoperative day; SD: standard deviation.
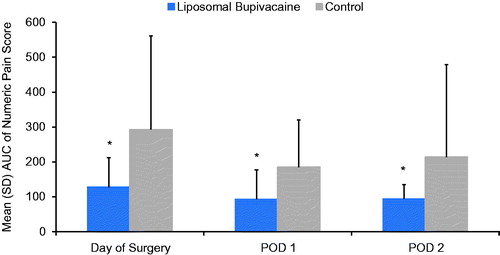
Table 3. Adjusted hospital charges and cost.