
Figures & data
Figure 1. Patient selection flow chart. Abbreviations. AF, atrial fibrillation; OAC, oral anticoagulant; ICD-9-CM; International Classification of Disease, 9th Revision, Clinical Modification; VTE, venous thromboembolism.
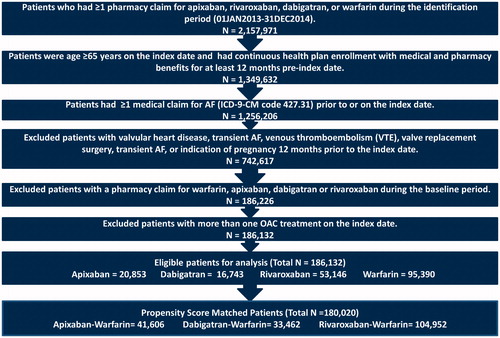
Table 1. Baseline characteristics and follow-up time in propensity score matched cohorts.
Figure 2. Hazard ratio of stroke/SE for propensity score matched patients. Abbreviations. HR, hazard ratio; CI, confidence interval; SE: systemic embolism.
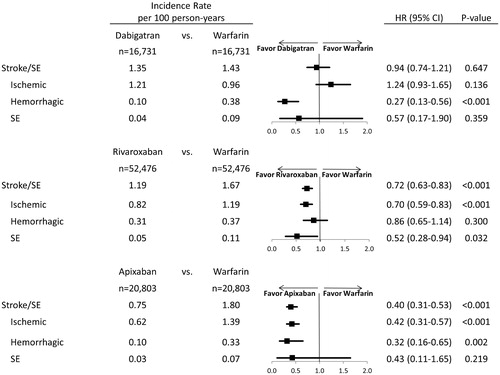
Figure 3. Hazard ratio of major bleeding for propensity score matched patients. Abbreviations. HR, hazard ratio; CI, confidence interval; GI, Gastrointestinal; ICH, Intracranial hemorrhage.
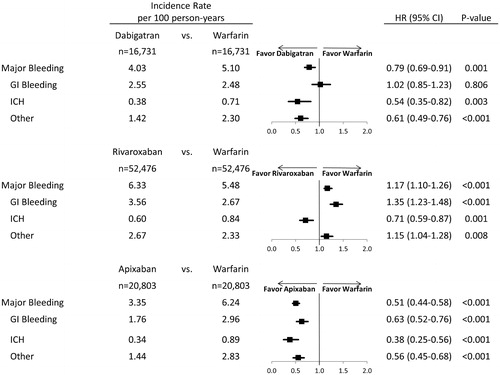
Figure 4. Stroke-related medical costs PPPM for propensity score matched patients. *p = .064; **p = .002; ***p < .001. Abbreviations. PPPM, per patient per month; CI, confidence interval; SE, systemic embolism.
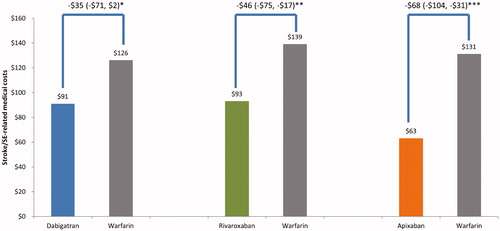
Figure 5. Major-bleeding-related medical costs PPPM for propensity score matched patients. *p = .036; **p = .177; ***p < .001. Abbreviations. PPPM, per patient per month; CI, confidence interval.
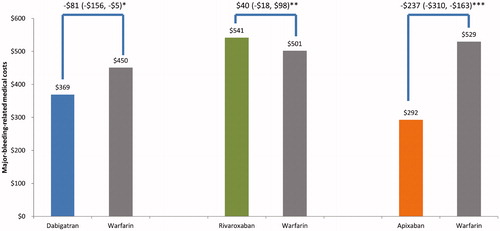
Table 2. Dose sensitivity analysis for propensity score matched patients.
Table 3. Hazard ratio of stroke/SE and major bleeding for propensity score matched patients in the sensitivity analyses.