
Figures & data
Table 1. Baseline characteristics overall and by visual acuity and treatment sub-group.
Table 2. Number of eyes receiving other interventions before and after treatment with fluocinolone intravitreal implant.
Figure 1. Attrition. FAc, fluocinolone acetonide; VEGF, vascular endothelial growth factor.
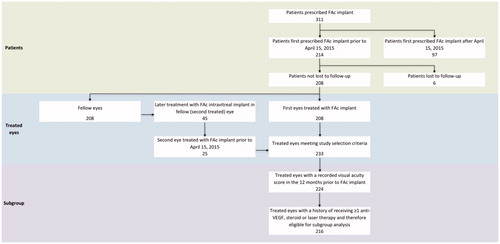
Figure 2. Change in visual acuity in the 12 months before and after fluocinolone intravitreal implant. (a) LogMAR scale. (b) ETDRS letters. Visual acuity measurements recorded in the 12 months before and after FAc implant were included. Linear interpolation was used to impute missing values between visual acuity scores. Nearest observation carried forward and backwards was used to impute missing values prior to the first and after the last recorded measurement. Imputation was carried out in two parts, day –365 to day 0 and day 1 to day 365.
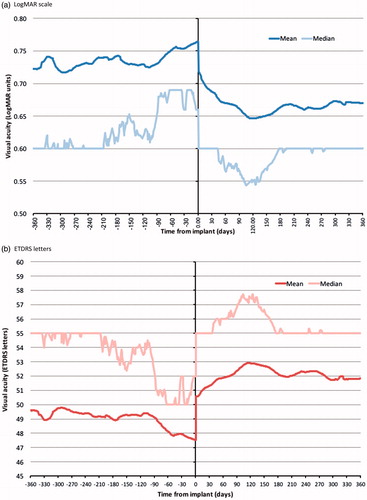
Table 3. Change in visual acuity (baseline value varies according to availability of pairs of visual acuity values at baseline and during follow-up).
Figure 3. Percentage of fluocinolone acetonide treated eyes achieving (a) ≥ 5, ≥ 10, and ≥15 letter improvement in ETDRS score and (b) ≥ 5, ≥ 10, and ≥15 letter worsening in ETDRS score overall and by visual acuity and treatment sub-group. VA, visual acuity.
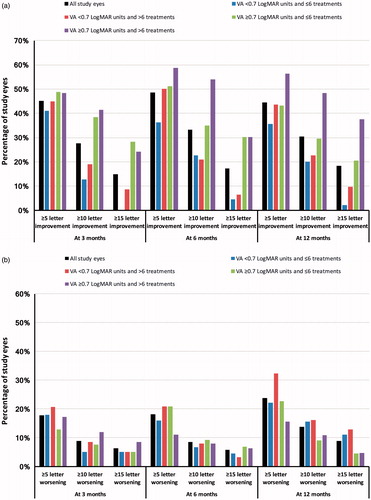
Figure 4. Change in visual acuity (LogMAR scale) post-index by sub-group. (a) At 3 months by visual acuity sub-group; (b) At 3 months by treatment sub-group; (c) At 3 months by visual acuity and treatment sub-group; (d) At 6 months by visual acuity sub-group; (e) At 6 months by treatment sub-group; (f) At 6 months by visual acuity and treatment sub-group; (g) At 12 months by visual acuity sub-group; (h) At 12 months by treatment sub-group; (i) At 12 months by visual acuity and treatment sub-group.
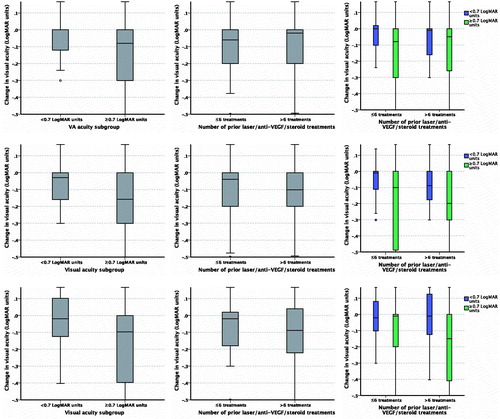
Table 4. Change in intraocular pressure for paired values where these were available (baseline value varies according to availability of IOP at baseline and the respective time-point).
Table 5. Intraocular pressure-lowering therapy before and after implant.