
Figures & data
Table 1. Baseline characteristics overall and by baseline central foveal thickness.
Table 2. Change in central foveal thickness.
Figure 1. Change in (a) central foveal thickness and (b) central subfield thickness 12 months before and after fluocinolone intravitreal implant. Linear interpolation was used to impute missing values between CFT and CST scores. Nearest observation carried forward and backwards was then used to impute missing values prior to the first and after the last recorded measurement. Imputation was carried out in two parts, day –365 to day 0 and day 1 to 365. Individuals with no measurement prior to and post-implant were excluded (n = 60 for (a) and n = 52 for (b)).
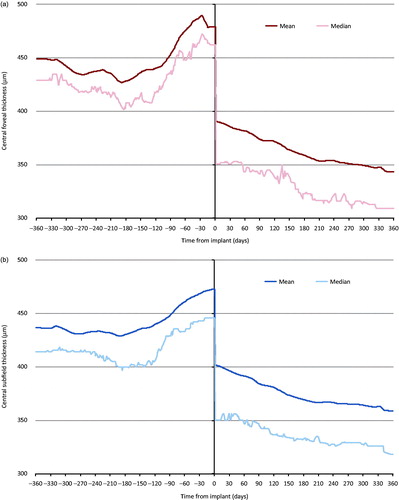
Figure 2. Cumulative frequency for central foveal thickness recorded at baseline and 12 months post-FAc implant.
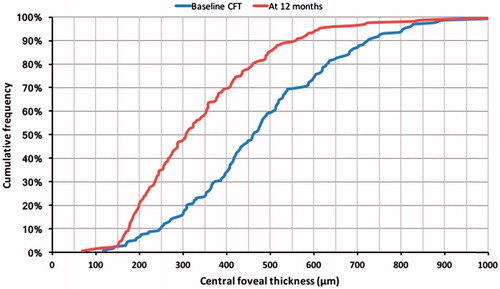
Figure 3. Central foveal thickness (CFT) at baseline and 12 months post-implant. (a) Distribution of FAc treated eyes by CFT category at FAc implant and after 12 months follow-up. (b) Distribution of FAc treated eyes achieving a CFT of ≤200 µm, > 200 and ≤300 µm, > 300 µm and ≤400 µm, and >400 µm at 12 months post-implant by CFT at time of FAc implant. (c) CFT at FAc implant and after 12 months follow-up by CFT category at implant. (d) Change in CFT between FAc implant and 12 months follow-up by CFT category at implant.
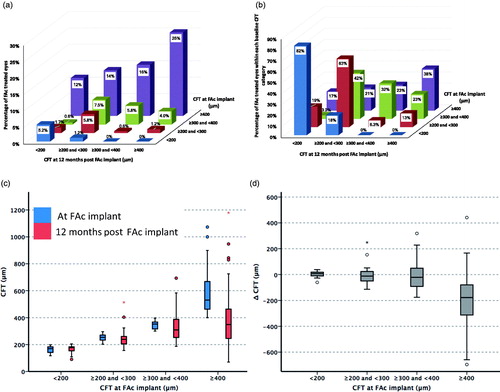
Figure 4. Visual acuity 12 months prior to and post-FAc implant in study eyes (a) with a central foveal thickness (CFT) < 200 µm at FAc implant (n = 12), and (b) CFT ≥200 µm at FAc implant and <200 µm at 12 months post-FAc implant (n = 24).
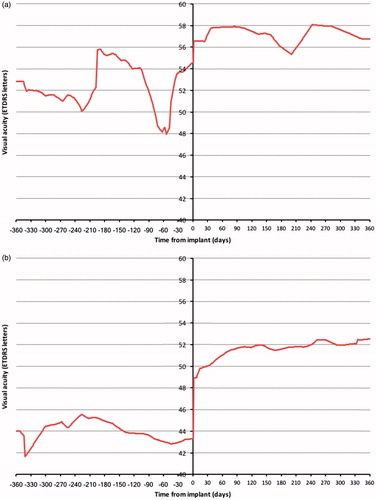
Figure 5. Correlates between central foveal thickness (CFT) and visual acuity. (a) Visual acuity and CFT at FAc implantation. (b) Visual acuity and CFT at 12 months post-FAc implant. (c) All pairs of visual acuity and CFT measurements between 12 months prior to and 12 months post-FAc implant. (d) Change in visual acuity and change in CFT between FAc implant and 12-month follow-up. r, Pearson’s correlation coefficient, R2, coefficient of determination. Only visual acuity and CFT measurements recorded on the same date were included.
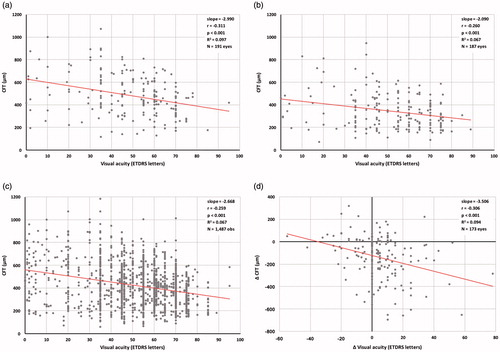
Table 3. Change in central subfield thickness.