
Figures & data
Figure 1. Data disposition flowchart.Note: Thicker lines bordering the boxes in this figure indicate groups or subgroups used in the analyses.
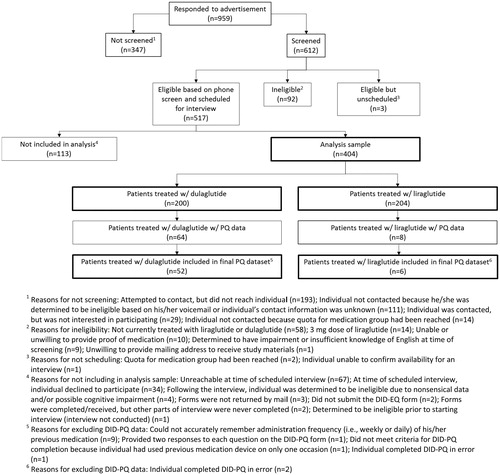
Table 1. Demographic and clinical characteristics.
Table 2. ANCOVAs comparing patient perceptions of the dulaglutide and liraglutide devices on the DID-EQTable Footnotea (N = 404).
Figure 2. Percentages of respondents who selected each response option of the DID-PQCitation1 global items (N = 58).
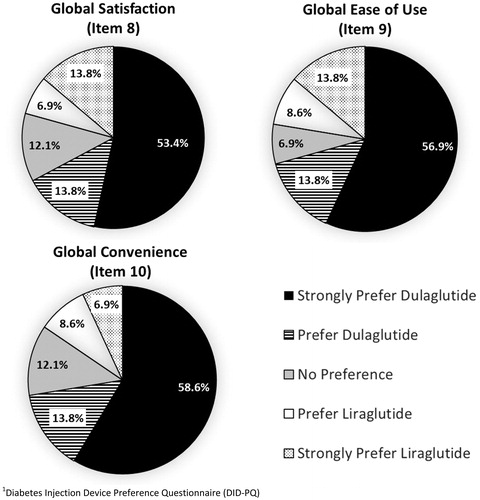
Table 3. Frequencies and percentages of respondents who selected each response option of the DID-PQa (N = 58).