
Figures & data
Figure 1. (a) Example of calculation of PDC using dispensation only data. PDC is calculated using either a fixed interval or a last-refill interval. (b) Example of calculation of PDC using linked dispensation and prescription data. PDC is calculated using either any gap or a three-month prescription gap.
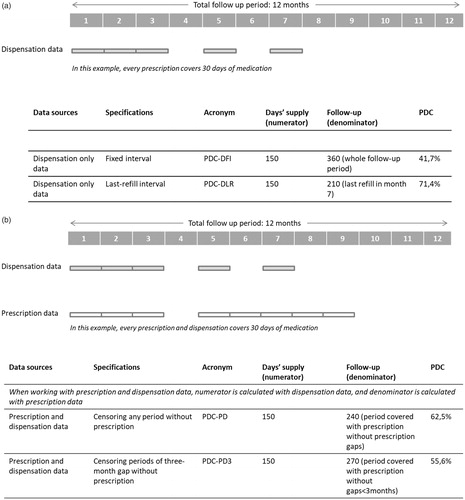
Table 1. Definitions used in this study.
Figure 2. Differences between using dispensation only data or linked dispensation and prescription data with regard to the identification of the index date and patient inclusion for PDC calculation.
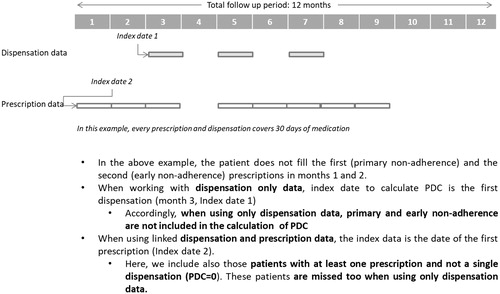
Table 2. Baseline characteristics of the ESOSVAL cohort.
Table 3. Mean PDC and categorical PDC at 12 months using dispensation-only data and using linked prescription and dispensation data.
Table 4 Mean PDC and categorical PDC at 24 months using dispensation-only data and using linked prescription and dispensation data.
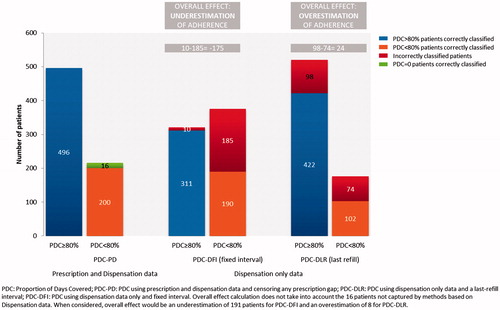
Figure 3. Patient misclassification in our cohort using dispensation data only versus using prescription and dispensation data.
Appendix 1. Periods of effective assessment when the follow-up is defined at 24 months using different PDC calculation methods.