
Figures & data
Figure 1. Diagrammatic representation of the Markov model.
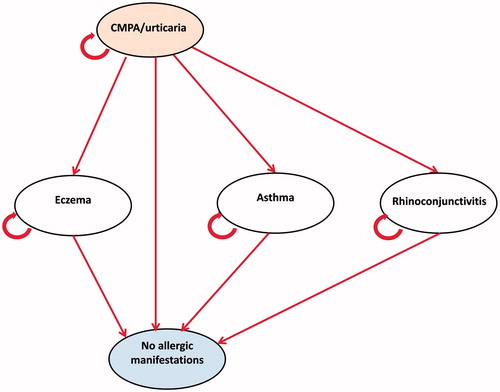
Figure 2. Time-series forecasting of the clinical outcomes from the RCTCitation12. (a) Manifestation of urticaria; (b) manifestation of eczema; (c) manifestation of asthma; (d) manifestation of rhinoconjunctivitis; (e) manifestation of symptomatic patients; (f) acquisition of tolerance to cow’s milk.
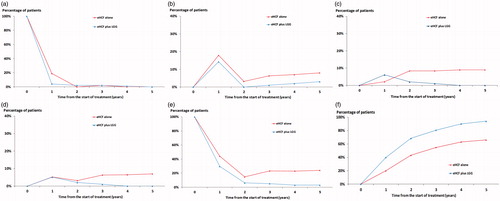
Table 1. Annual transition probabilities in the Markov model.
Table 2. Estimates of resource use incorporated into the model.
Table 3. Unit resource costs at 2016/17 prices.
Table 4. Expected clinical outcomes at three and five years from the start of treatment.
Table 5. Mean amount of resource use per patient over five years from the start of treatment.
Table 6. Mean cost (at 2016/17 prices) per patient over five years from the start of treatment (percentage of total cost in parentheses).
Table 7. Cost-effectiveness analyses at three and five years from the start of treatment.
Figure 3. Scatterplot of the incremental cost-effectiveness of eHCF plus LGG compared to eHCF alone (10,000 iterations of the model); (a) Measure of effectiveness is probability of being symptom-free; (b) measure of effectiveness is probability of acquiring tolerance to cow’s milk.
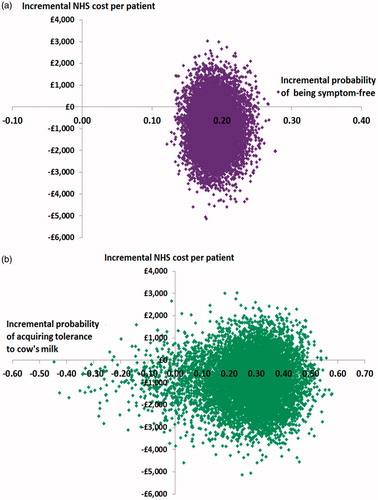
Table 8. Sensitivity analyses.