7,153
Views
18
CrossRef citations to date
0
Altmetric
Gastroenterology

Dose escalation and switching of biologics in ulcerative colitis: a systematic literature review in real-world evidence

ORCID Icon, , , ORCID Icon & ORCID Icon
Pages 1911-1923 | Received 17 Aug 2018, Accepted 12 Jun 2019, Published online: 19 Jul 2019

Figures & data

Figure 1. PRISMA chart for the review on dose escalation and treatment switching in UC.

Figure 1. PRISMA chart for the review on dose escalation and treatment switching in UC.

Table 1. Characteristics of identified studies.

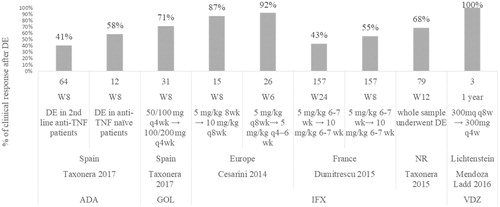
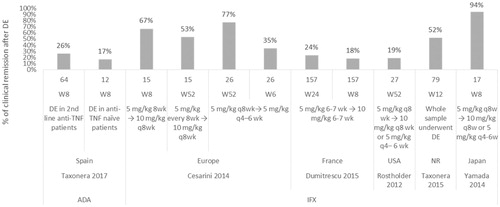
Table 2. Dose escalation outcomes in daily practice.

Figure 2. Percentage of patients with clinical response after dose escalation. Taxonera 2017 (ADA)Citation53, Taxonera 2017 (GOL)Citation50 , Cesarini 2014 (IFX)Citation28, Dumitrescu 2015 (IFX)Citation31, Taxonera 2015 (IFX)Citation52, Ladd 2016 (VDZ)Citation40.

Figure 2. Percentage of patients with clinical response after dose escalation. Taxonera 2017 (ADA)Citation53, Taxonera 2017 (GOL)Citation50 , Cesarini 2014 (IFX)Citation28, Dumitrescu 2015 (IFX)Citation31, Taxonera 2015 (IFX)Citation52, Ladd 2016 (VDZ)Citation40.

Figure 3. Percentage of patients in clinical remission after dose escalation. Taxonera 2017 (ADA)Citation53, Cesarini 2014 (IFX)Citation28, Dumitrescu 2015 (IFX)Citation31, Taxonera 2015 (IFX)Citation52, Rostholder 2012 (IFX)Citation45, Yamada 2014 (IFX)Citation55.

Figure 3. Percentage of patients in clinical remission after dose escalation. Taxonera 2017 (ADA)Citation53, Cesarini 2014 (IFX)Citation28, Dumitrescu 2015 (IFX)Citation31, Taxonera 2015 (IFX)Citation52, Rostholder 2012 (IFX)Citation45, Yamada 2014 (IFX)Citation55.

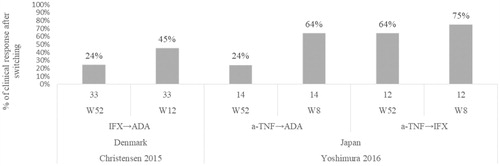
Table 3. Treatment switching in daily clinical practice.

Figure 4. Percentage of patients with clinical response after switching Christensen 2015Citation29, Yoshimura 2016Citation56.

Figure 4. Percentage of patients with clinical response after switching Christensen 2015Citation29, Yoshimura 2016Citation56.