
Figures & data
Table 1. Baseline demographics and characteristics of patients in 6-, 12-, and 24- month pre- and post-index periods.
Figure 1. Adherence to HF medication classes for the 12 months pre-index and post-index periods. *Indicates p-value <.05. Abbreviations. ACE-I, Angiotensin-converting enzyme inhibitor; ARB, Angiotensin receptor blocker.
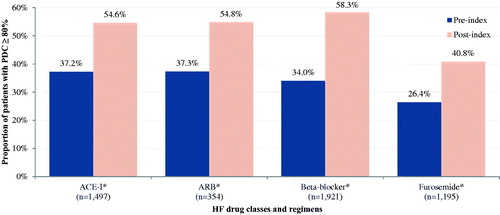
Table 2. Adherence to HF GDMT classes during the pre-index and post-index periods.
Figure A1. Adherence to medication regimens 1 and 2 during the 12 months pre- and post-CRT implantation. On an average, mean PDC was lower for regimens 1 and 2 over the total course of the 12 months pre- versus 12-months post-CRT implantation. Though an increasing trend in PDC is observed leading up to CRT implantation and a slight decrease in PDC is observed following this point, PDC is observed to remain higher than observed pre-index levels (seen ≥3–4 months prior to CRT implantation) through the end of the post-CRT 12-month period.
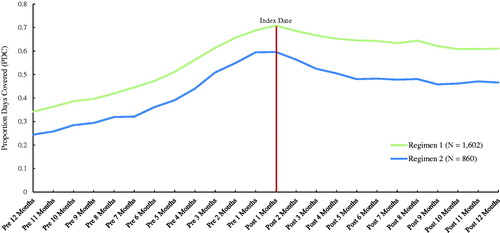
Table A1. Adherence to HF medication regimens during the pre-index and post-index periods.