
Figures & data
Figure 1. Study schematic. For this post-hoc analysis, time was measured by investigators. When participants made an error, a trainer corrected the mistake and participants repeated the steps until mastery of the procedure. Number of repeats due to procedural errors (marked with an “X”) were counted. Time was measured for correctly performed procedural steps (white arrows) and steps repeated due to procedural errors (gray arrows).
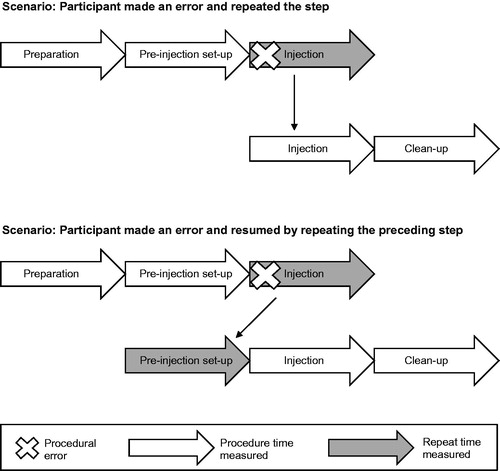
Table 1. Demographics and clinical characteristics.
Figure 2. Training time. Overall time with and without errors for the Ateos and FlexTouch devices. Data presented are mean ± standard deviation (SD). p-Values were generated from the Student’s t-test. N represents the number of participants evaluated.
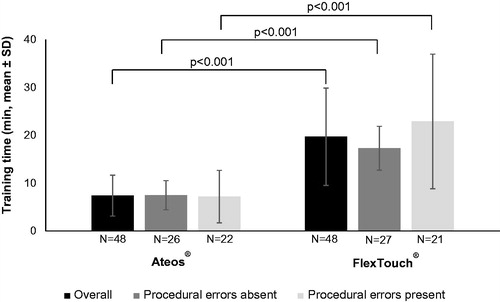
Figure 3. Time required for completion of self-injection steps.
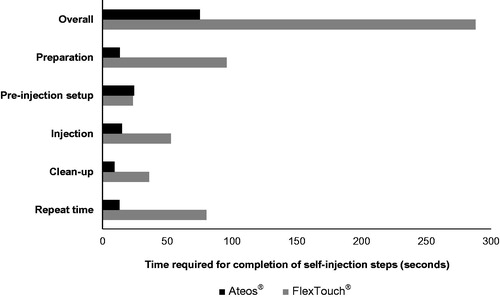
Table 2. Self-injection repetitions.