
Figures & data
Figure 1. Association of demographic factors and comorbidities with overactive bladder in men and women. Abbreviation. OAB, overactive bladder. Statistically non-significant data are not shown.
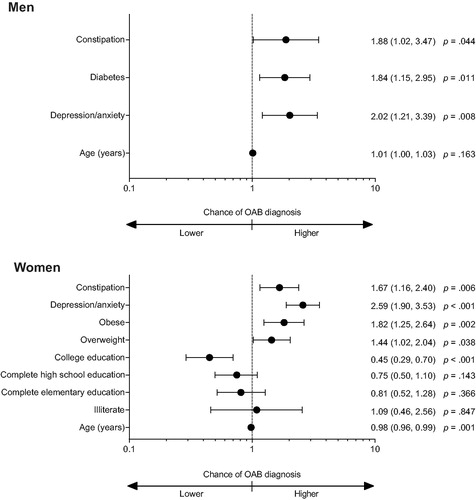
Figure 2. Chance of missing work in men and women with a possible diagnosis of overactive bladder: forest plot of multiple regression models; adjusted odds ratios (95% CI). Statistically non-significant data are not shown.
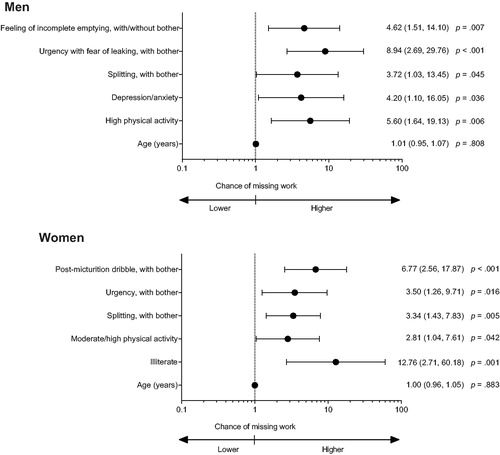
Figure 3. Chance of limitation of daily and leisure activities in men and women with a possible diagnosis of overactive bladder: Forest plot of multiple regression models; adjusted odds ratios (95% CI). Abbreviations. CI, confidence interval; SUI, stress urinary incontinence; UUI, urgency urinary incontinence. Statistically non-significant data are not shown.
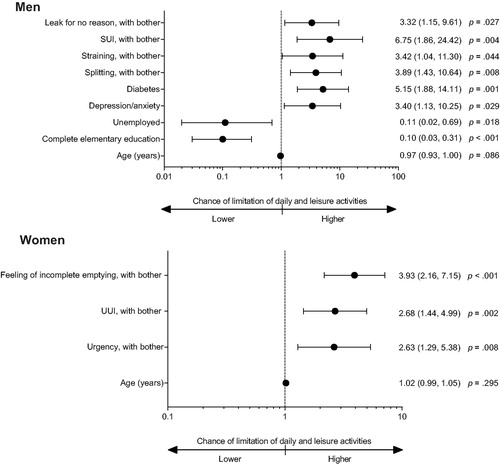
Figure 4. Chance of worse QoL due to LUTS in men and women with a possible diagnosis of overactive bladder: Forest plot of multiple regression models; adjusted odds ratios (95% CI). Abbreviations. CI, confidence interval; LUTS, lower urinary tract symptoms; QoL, quality of life; SUI, stress urinary incontinence. Statistically non-significant data are not shown.
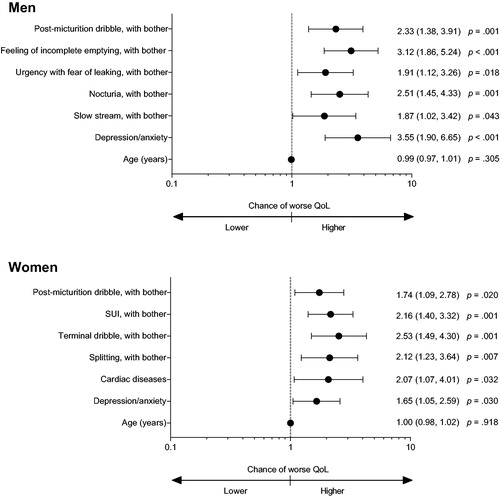
Figure 5. Chance of seeking treatment in men and women with a possible diagnosis of overactive bladder: Forest plot of multiple regression models; adjusted odds ratios (95% CI). Abbreviations. CI, confidence interval. Statistically non-significant data are not shown.
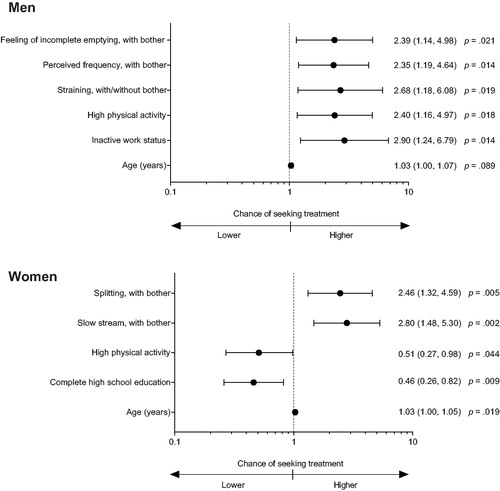
Figure 6. Chance of treatment in men and women with a possible diagnosis of overactive bladder: Forest plot of multiple regression models; adjusted odds ratios (95% CI). Abbreviations. CI, confidence interval. Statistically non-significant data are not shown.
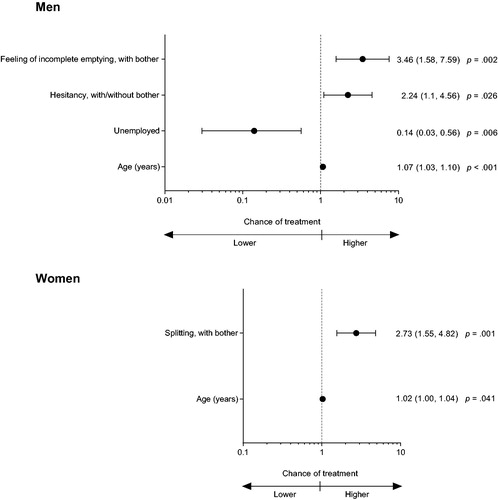
Figure 7. Chance of treatment discontinuation in men and women with a possible diagnosis of overactive bladder: Forest plot of multiple regression models; adjusted odds ratios (95% CI). Abbreviations. CI, confidence interval. Statistically non-significant data are not shown.
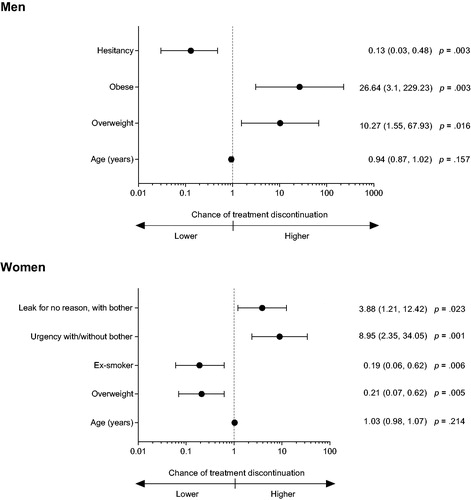
Figure 8. Chance of treatment dissatisfaction in men and women with a possible diagnosis of overactive bladder: Forest plot of multiple regression models; adjusted odds ratios (95% CI). Abbreviations. CI, confidence interval; UUI, urgency urinary incontinence. Statistically non-significant data are not shown.
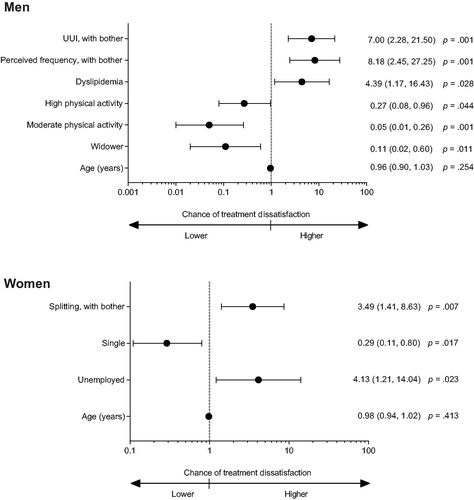
Table 1. Impact of OAB on work, daily and leisure activities; treatment seeking, treatment, treatment satisfaction and treatment discontinuation by age in men with a possible diagnosis of OAB.
Table 2. Impact of OAB on work, daily and leisure activities; treatment seeking, treatment, treatment satisfaction and treatment discontinuation by age in women with a possible diagnosis of OAB.
Supplemental OAB Models
Download MS Word (547.2 KB)Supplemental Table 3
Download MS Word (20.4 KB)Supplemental Table 2
Download MS Word (18.6 KB)Supplemental Table 1
Download MS Word (14.1 KB)Supplemental Material
Download MS Word (96.3 KB)Supplemental Material
Download MS Word (260.8 KB)Data availability
Access to anonymized individual participant level data will not be provided for this trial as it meets one or more of the exceptions described on www.clinicalstudydatarequest.com under “Sponsor Specific Details for Astellas”.