
Figures & data
Figure 1. Clinician assessment of perceived risk of metastasis with molecular 40-GEP Class and clinicopathologic features in cutaneous squamous cell carcinoma. (A) Clinicians (n = 162) reported how risky they perceived a feature with 1 and 10 being the lowest and highest risk, respectively. Median values are plotted with error bars denoting 95% confidence intervals. p Values for comparisons of risk between two features are shown in the table and reflect Friedman tests with a Dunn’s correction for multiple comparisons. (B) Stacked histogram for clinician rating of risk of 40-GEP Class call: Class 1 (blue); Class 2A (orange); Class 2B (red).
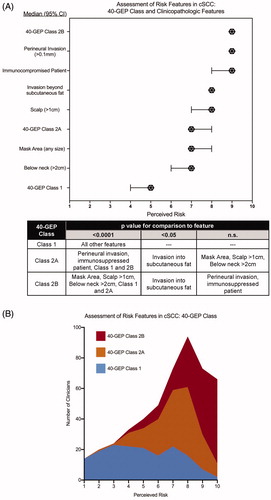
Table 1. Clinician Demographics (n = 162).
Figure 2. Effect of 40-GEP test results on clinicians’ management decisions regarding: follow-up intervals, SLNB, nodal imaging, adjuvant radiation, and adjuvant chemotherapy. Percentage of clinicians who would develop either a low (blue bar), moderate (orange bar), or high (red bar) intensity management plan based on pre-test (no 40-GEP data), then, post-test (Class 1, 2A, or 2B) results. Using a Friedman’s test with Dunn’s multiple comparisons correction, statistical significance was determined for each vignette when all post-test 40-GEP results (Class 1, 2A, or 2B) were compared to pre-test 40-GEP (no 40-GEP). F/U: follow-up; SLNB: sentinel lymph node biopsy; imaging: nodal imaging; chemo: adjuvant chemotherapy; RT: adjuvant radiation.
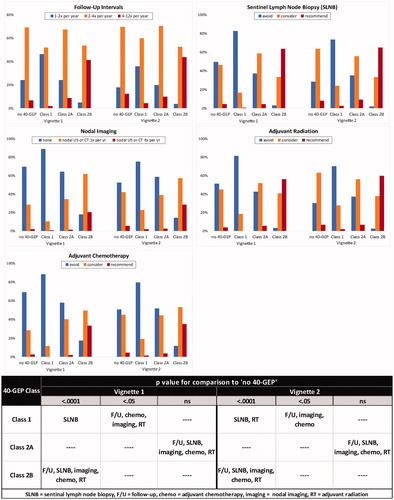
Table 3. Comparison of changes by management modality.
Table 2. Clinical characteristics of patient vignettes.