Figures & data
Figure 1. Typical operation procedure of a spring-actuated autoinjector. (a) Configuration and terminology. (b) Driving rod accelerated by a pre-compressed spring. (c) Driving rod impact onto the plunger. (d) Sliding motion of plunger and air gap compression. (e) Needle insertion into the skin. (f) Completion of needle insertion. (g) Injection of drug product. (h) Completion of drug delivery.
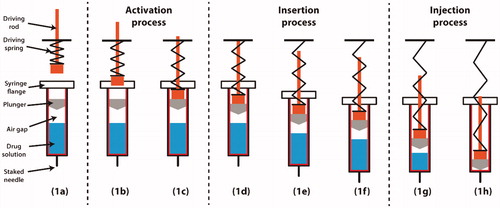
Figure 2. Photos of (left) Emgality and (right) Aimovig autoinjector device. Photos are taken at Purdue University.
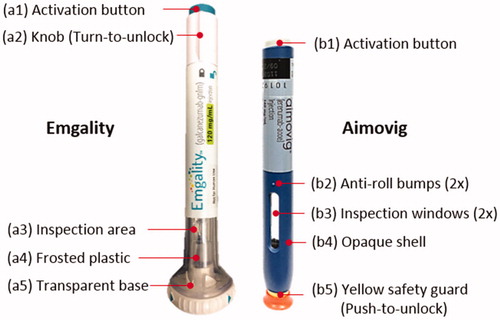
Table 1. Samples information and test matrix.
Figure 3. (a) Photo of the test section. (b) Schematic drawing of the experimental setup. (c) Synchronization of the testing instrument. The arrows are coded in chronological order.
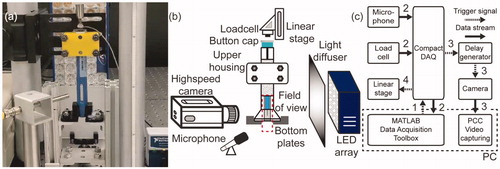
Figure 4. (a) and (c) are post-processed video sequences of the needle insertion process for Emgality and Aimovig devices, respectively. The time step between adjacent images is 0.25 ms. (b) and (d) are post-processed video sequences of the drug injection process at room temperature for Emgality and Aimovig devices, respectively. The time step between adjacent images is 500 ms.
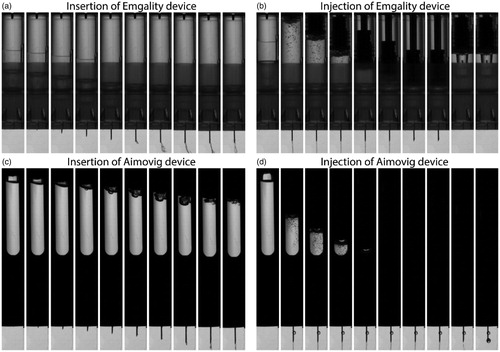
Table 2. Details of the testing instrument.
Table 3. List of measured quantities.
Figure 5. Example force profiles at the activation button from one tested sample during the autoinjector operation for (a) Emgality and (b) Aimovig devices at room temperature. The dashed line in (b) indicates the load cell measurement range. (c) Activation forces measured for all samples. In (c), solid lines indicate the group medians, shaded regions indicate the interquartile ranges, and the dashed lines indicate the data range (excluding outliers). p-Values are listed in c to represent the statistical significance between groups, and the red color (online version only) represents p-value smaller than the significant level, .0001.
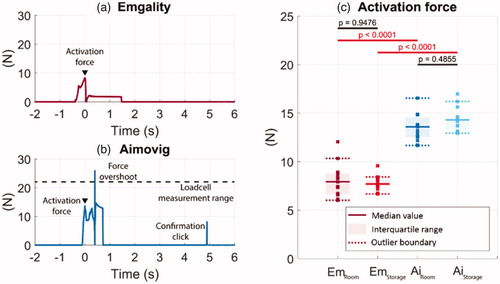
Figure 6. (a) Maximum needle lateral movement, (b) initial dispensing depth, (c) peak penetration depth, and (d) final penetration depth. Solid lines indicate the group medians, shaded regions indicate the interquartile ranges, and the dashed lines indicate the data range (excluding outliers). p-Values are listed in a, b, c, and d to represent the statistical significance between groups, and the red color (online version only) represents p-value smaller than the significant level, .0001.
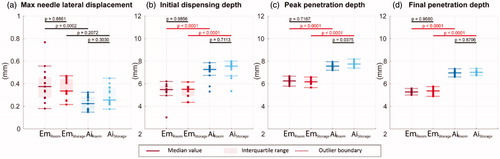
Figure 7. (a) Drug injection flow rate. (b) Drug injection duration. (c) The time duration between the device activation and injection completion clicks. Solid lines indicate the group medians, shaded regions indicate the interquartile ranges, and the dashed lines indicate the data range (excluding outliers). p-Values are listed in a, b, and c to represent the statistical significance between groups, and the red color (online version only) represents p-value smaller than the significant level, .0001.
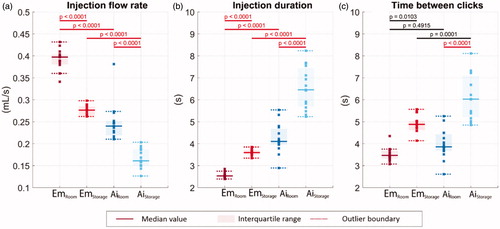
Figure 8. The remaining injection duration after the completion clicks. Solid lines indicate the group medians, shaded regions indicate the interquartile ranges, and the dashed lines indicate the data range (excluding outliers). p-Values are listed to represent the statistical significance between groups, and the red color (online version only) represents p-value smaller than the significant level, .0001.
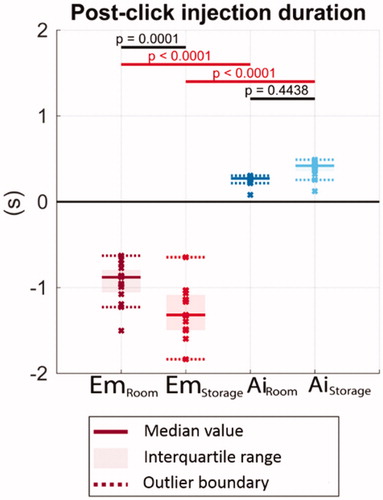
Figure 9. Comparison between insertion depth and skin layer thickness. Horizontal solid lines represent the mean final penetration depth at room temperature, and horizontal dash-dotted lines represent the two standard deviations (5–95 percentile range if normal distribution is assumed) of the insertion depth. Lower and upper (shown as Red and Blue in the online version) lines correspond to the Emgality and Aimovig device, respectively. The coloured vertical bars represent the SQ space for a particular BMI range. SQ and dermal thickness for BMI > 19.4 patients are obtained fromCitation30,Citation31. For SQ and dermal thickness when BMI is within 15 ∼ 19.4, we performed linear extrapolation using SQ and dermal thickness values when BMI is within 19.4 ∼ 24.9 and 25 ∼ 30, assuming SQ thickness increases linearly with BMI while dermal thickness is not sensitive to BMI. The 0 mm on the vertical axis represents the skin surface that is in contact with the autoinjector base. The black whiskers at the bottom and top of each bar indicate the variation in dermal-SQ and IM-SQ boundaries for that group, respectively.
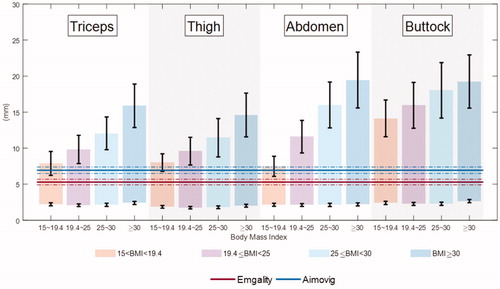
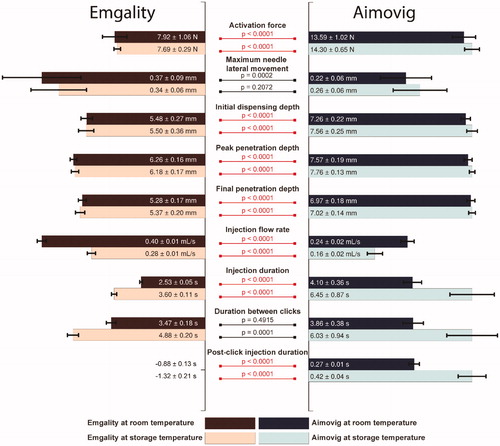
Figure 10. Overall comparison of performances between test groups. For each test category, bar lengths are normalized by the largest median among the four test groups. Texts in each bar show the median ± 0.5 interquartile range for that test group. The bars for the post-click injection durations for the Emgality device are not shown due to their negative values. p-Values are listed to represent the statistical significance between groups, and the red color (online version only) represents p-value smaller than the significant level, .0001.