
Figures & data
Table 1. Definition of health states.
Figure 1. Outcome definitions plotted against time in months.
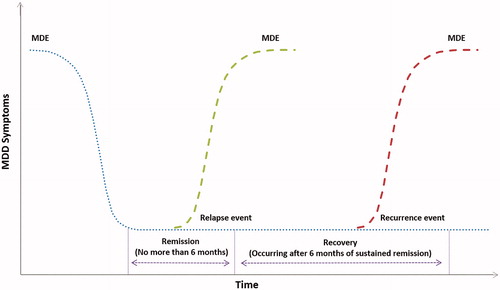
Table 2. Demographic details of patients with MDD during the management of TRD.
Table 3. Mean (SD) number of events encountered in each health state per month (28 days) during the management of TRD.
Table 4. Drugs prescribed to >5% of patients with TRD over a 2 year follow up period (%).
Table 5. Mean (SD) number of non-drug treatment sessions per month (28 days) in each health state during the management of TRD.
Figure 2. Mean HCRU costs by health state (£) per patient per month (28 days) during the management of TRD.
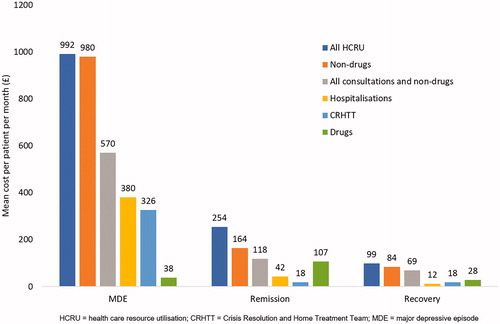
Table 6. Mean (SD) cost per patient per month (28 days) of non-drug treatment sessions in each health state during the management of TRD.
List of non-drug resources, unit costs and source.