
Figures & data
Table 1. Participant-reported demographic and clinical characteristics.
Table 2. Site-reported clinical characteristics.
Figure 1. Descriptive Statistics for the MOS SF-36. 1Scores have a possible range of 0–100. Higher scores indicate more favorable health status. The general population norm-based score is 50 with a standard deviation of 10. 2The scoring algorithm used to calculate the MOS SF-36 scores was developed by Hays et al. [Citation41]. This version of the scoring algorithm does not incorporate weights for calculating the mental component summary (MCS) and physical component summary (PCS). The updated weights for the MCS and PCS are copyrighted and not publicly available for use. As such, in these analyses, MCS and PCS scores were not calculated for the MOS SF-36.
![Figure 1. Descriptive Statistics for the MOS SF-36. 1Scores have a possible range of 0–100. Higher scores indicate more favorable health status. The general population norm-based score is 50 with a standard deviation of 10. 2The scoring algorithm used to calculate the MOS SF-36 scores was developed by Hays et al. [Citation41]. This version of the scoring algorithm does not incorporate weights for calculating the mental component summary (MCS) and physical component summary (PCS). The updated weights for the MCS and PCS are copyrighted and not publicly available for use. As such, in these analyses, MCS and PCS scores were not calculated for the MOS SF-36.](/cms/asset/daf5a232-9ab8-4645-95e0-c1696c31b25b/icmo_a_1865889_f0001_c.jpg)
Figure 2. Descriptive Statistics for the BPI-SF. 1BPI-SF item scores range from 0 to 10, with higher scores indicating greater pain severity or interference. Pain Severity is a composite of the four pain items (a mean severity score). Pain interference is scored as the mean of the seven interference items if more than 50%, or four of seven, of the total items have been completed on a given administration
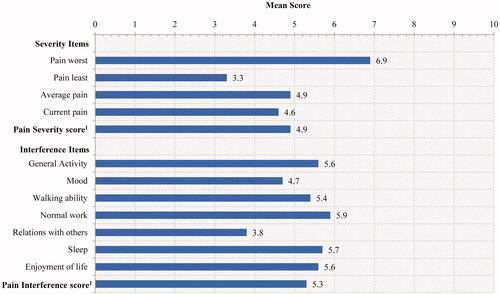
Table 3. POMAQ results (items 1–8 and 10–19).
Table 4. EMR data (for year prior to study start).