Figures & data
Table 1. Caregiver characteristics (N = 14)a.
Table 2. Characteristics of individuals with AADC deficiency (N = 13).
Table 3. Data saturation matrix for symptoms, function and impacts.
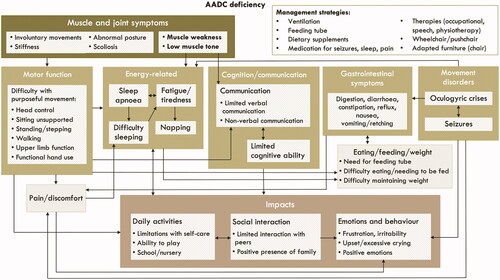
Figure 1. Conceptual model illustrating the relationships between symptoms and impacts of AADC deficiency. The conceptual model is designed to be read from the top, where there are the most proximal symptoms and functional impairments, to the bottom, where there are more distal impacts. The arrows show the relationships between the concepts, which are either unidirectional or bidirectional (for example, gastrointestinal symptoms impact eating and vice versa). Some relationships are between the larger external boxes, for example, all muscle and joint symptoms were reported to impact motor function. Other relationships are between the internal boxes, for example, muscle weakness and low muscle tone were reported to impact communication, but not cognitive function.