
Figures & data
Table 1. Differences in Baseline Characteristics
Table 1. Differences in Baseline Characteristics
Table 2. Response Rates and Comparative Efficacy for Cilta-cel versus Ide-cel
Table 2. Response Rates and Comparative Efficacy for Cilta-cel versus Ide-cel
Table 3. Estimated Medians and Comparative Efficacy for Cilta-cel versus Ide-cel
Table 3. Estimated Medians and Comparative Efficacy for Cilta-cel versus Ide-cel
Figure 1. Observed (unadjusted) and adjusted (base case) Kaplan–Meier plots of a duration of response. Note. Base case results adjusted for refractory status, cytogenetic profile, revised International Staging System stage, and all plasmacytomas. Abbreviations: ESS, effective sample size.
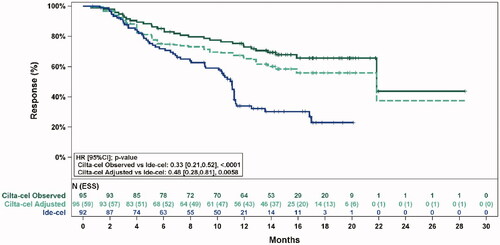
Figure 1. Observed (unadjusted) and adjusted (base case) Kaplan–Meier plots of a duration of response. Note. Base case results adjusted for refractory status, cytogenetic profile, revised International Staging System stage, and all plasmacytomas. Abbreviations: ESS, effective sample size.
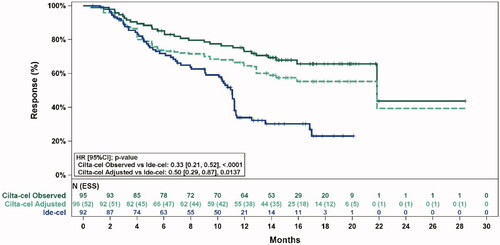
Figure 2. Observed (unadjusted) and adjusted (base case) Kaplan–Meier plots of progression-free survival. Note. Base case results adjusted for refractory status, cytogenetic profile, revised International Staging System stage, and all plasmacytomas. Abbreviations: ESS, effective sample size.
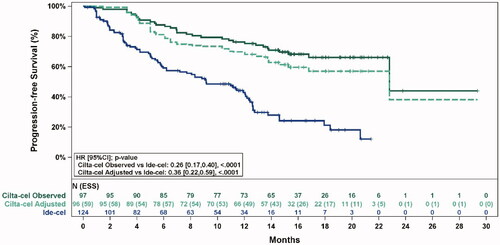
Figure 2. Observed (unadjusted) and adjusted (base case) Kaplan–Meier plots of progression-free survival. Note. Base case results adjusted for refractory status, cytogenetic profile, revised International Staging System stage, and all plasmacytomas. Abbreviations: ESS, effective sample size.
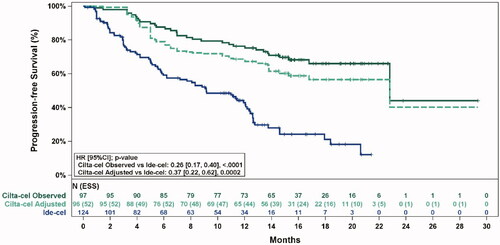
Figure 3. Observed (unadjusted) and adjusted (base case) Kaplan–Meier plots of overall survival. Note. Base case results adjusted for refractory status, cytogenetic profile, revised International Staging System stage, and all plasmacytomas. Abbreviations: ESS, effective sample size.
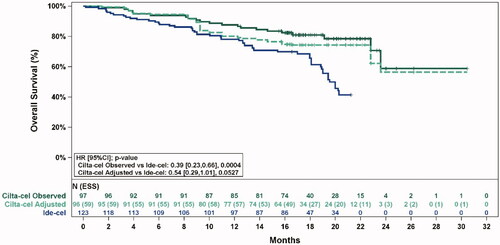
Figure 3. Observed (unadjusted) and adjusted (base case) Kaplan–Meier plots of overall survival. Note. Base case results adjusted for refractory status, cytogenetic profile, revised International Staging System stage, and all plasmacytomas. Abbreviations: ESS, effective sample size.
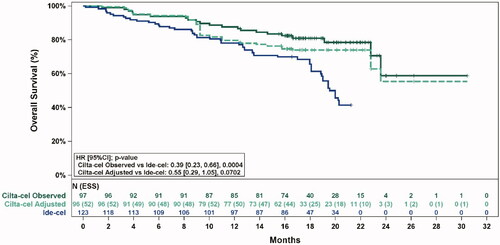
Table E.1: Detailed Sensitivity Analysis Results for Overall Response Rate, Complete Response or Better Rate, Duration of Response, Progression-free Survival, and Overall Survival
Table E.1: Detailed Sensitivity Analysis Results for Overall Response Rate, Complete Response or Better Rate, Duration of Response, Progression-free Survival, and Overall Survival