
Figures & data
Table 1. Summary of demographics.
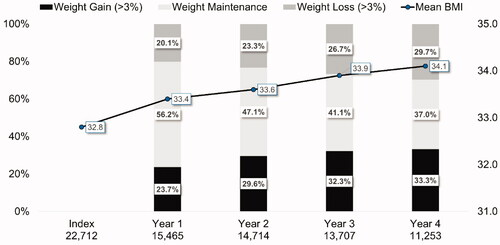
Figure 1. Mean BMI by year and weight change from index period. Bars represent the percentage of patients that gained >3% weight (red bar), maintained their weight (yellow), or lost >3% weight (green) in comparison to the previous year. Mean body mass index (BMI) for each year is indicated with the blue line.
Supplemental material