
Figures & data
Figure 1. Patient disposition flowchart. aPatients were excluded for non-continuous medical and pharmacy enrolment 24-month pre-index event and <18 years of age. Abbreviations. CGRP: calcitonin gene-related peptide; mAbs: monoclonal antibodies; P0: patients with CGRP mAbs as their initial PMM; P1: patients with CGRP mAbs after using one class of PMM; P2: patients with CGRP mAbs after using 2 classes of PMM; P3: patients with CGRP mAbs after ≥3 or more classes of PMM; PMM: preventive migraine medication.
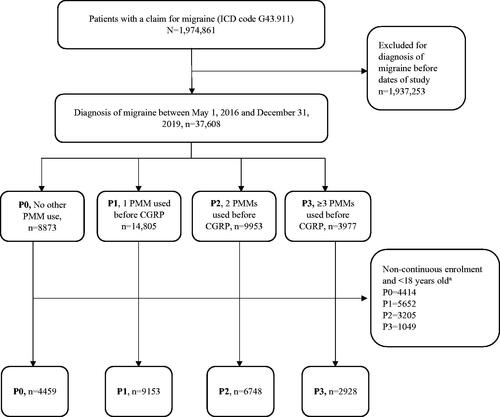
Table 1. Demographic and patient characteristics at index event – unadjusted.
Figure 2. Pairwise comparisons between groups for total direct healthcare costs – GPS matched. Pairwise comparisons were made between P0 (comparator) and other groups (P1, P2, P3) at p < .005. *Total cost and Imaging and procedure cost: significant difference between P0 vs. P3 (p ≤ .005). ***ER cost: significant difference between: P1 vs. P3 (p = .002). #Pharmacy cost: significant difference between: P0 vs. P1, P0 vs. P2 (p < .001) and P0 vs. P3, p = .005. ±Outpatient cost: significant difference between P0 vs. P1, P0 vs. P2, and P0 vs. P3, p ≤ .001.
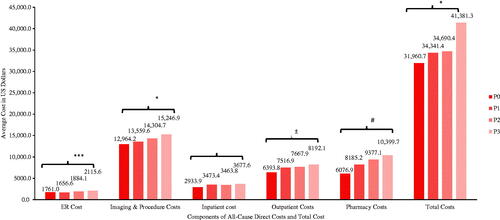
Table 2. All-cause HCRU in 24-month pre-index period – GPS matched.
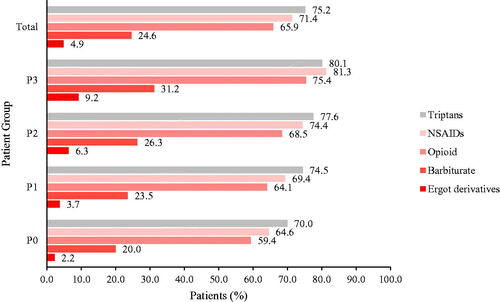
Figure 3. Acute medication uses a 24-month pre-index – unadjusted. NSAIDs: nonsteroidal anti-inflammatory drugs.
Supplemental Material
Download MS Word (181.3 KB)Data availability statement
The datasets generated during and/or analyzed during the current study are not publicly available due to their proprietary nature and the associated restrictions that apply to their availability to external sources. Data may be made available through the corresponding author upon reasonable request and with permission of IBM MarketScan Early View database.