Figures & data
Figure 1. Timing of acquisition of selected parameters in the phase 3 study design. IC, informed consent; CT, computed tomography; MRI, magnetic resonance imaging; US, ultrasonography. †Red blood cell count and white blood cell count
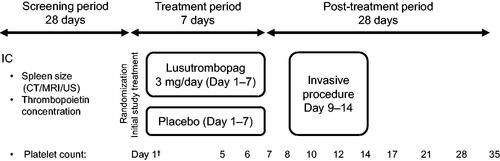
Table 1. Patient baseline characteristics of the intent-to-treat population (n = 97) in L-PLUS 1Citation8.
Figure 2. Correlation between the baseline platelet count and selected parameters in L-PLUS 1. (A) spleen index, (B) thrombopoietin concentration, (C) red blood cell count, and (D) white blood cell count. CI, confidence interval.
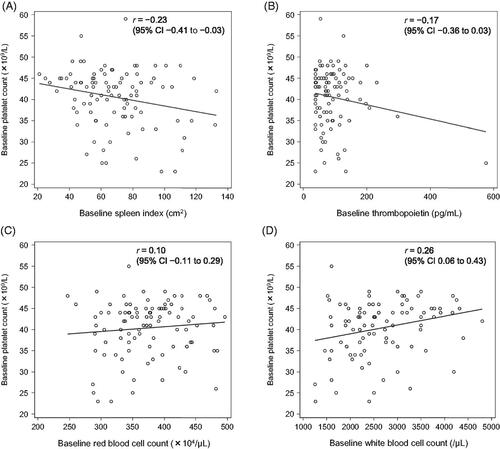
Figure 3. Association between the maximum change in platelet count from baseline and selected parameters in L-PLUS 1. (A) red blood cell count and (B) white blood cell count. In the regression analysis, the fixed effect was the treatment group and the covariates were the baseline platelet count, the baseline parameters, and the interaction between baseline parameters and treatment. Filled areas indicate 95% confidence intervals for predicted outcome: blue for lusutrombopag 3 mg and red for placebo. LUSU, lusutrombopag.
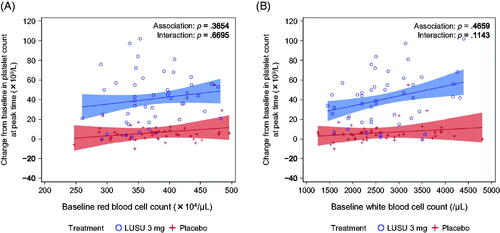
Figure 4. Time-dependent change from baseline in the platelet count by selected parameters in L-PLUS 1. (A) spleen index, (B) thrombopoietin concentration, (C) red blood cell count, and (D) white blood cell count. In the mixed-effect model for repeated measures analysis, the fixed effect was the group based on the target parameter, time point and the interaction effect (group and time point), and the covariate was the baseline platelet count, with unstructured covariance. Error bars indicate a 95% confidence interval of the predicted outcome.
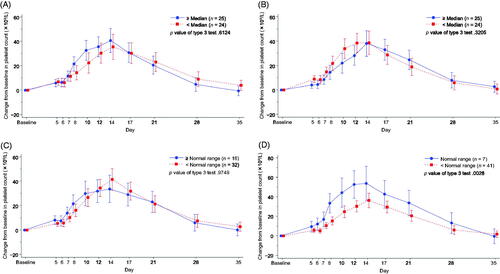
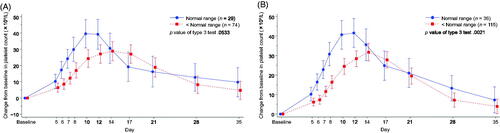
Figure 5. Time-dependent change from baseline in the platelet count by the white blood cell count in (A) L-PLUS 2 and (B) L-PLUS 1 plus L-PLUS 2. In the mixed-effect model for repeated measures analysis, the fixed effect was the group based on the target parameter, time point and the interaction effect (group and time point), and the covariate was the baseline platelet count, with unstructured covariance. Error bars indicate 95% confidence intervals of the predicted outcome.