
Figures & data
Figure 1. Study design. Abbreviations. ERAs, endothelin-receptor antagonists; PAH, pulmonary arterial hypertension; PDE5is, phosphodiesterase type 5 inhibitors.
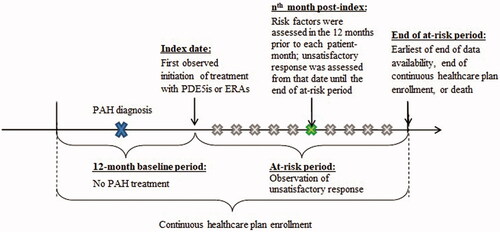
Table 1. Unsatisfactory clinical response during the at-risk period.
Figure 2. Sample selection flowchart. Abbreviations. CTEPH, chronic thromboembolic pulmonary hypertension; ERAs, endothelin-receptor antagonists; PAH, pulmonary arterial hypertension; PDE5is, phosphodiesterase type 5 inhibitors; PPA, prostacyclin pathway agent. Notes: 1. The index regimen was defined as the treatment initiated on the index date, along with any other treatment indicated for PAH initiated within a 60-day window after the index date.
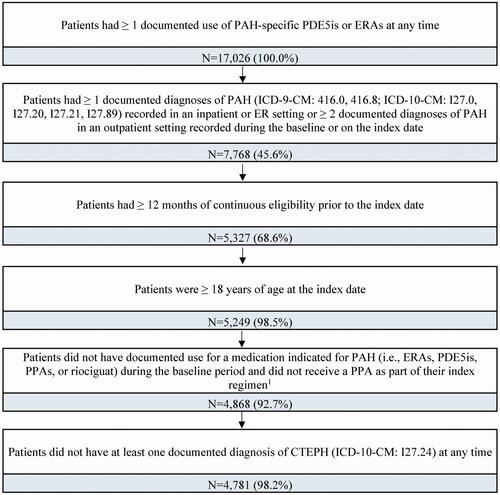
Table 2. Baseline characteristics.
Figure 3. Top 20 most important risk factors based on random survival model algorithm. Abbreviations. PAH, pulmonary arterial hypertension; RHC, right heart catheterization.
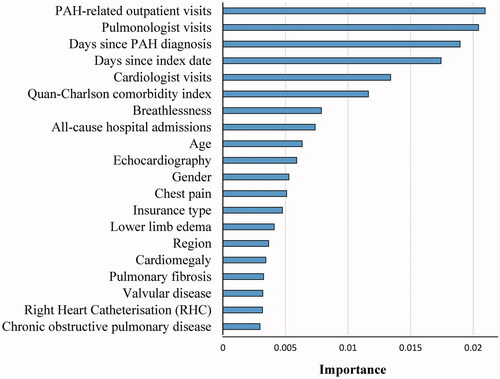
Table 3. Algorithm performance at key time points.
Table 4. Simplified risk score.
Figure 4. Kaplan-Meier curves for unsatisfactory response by risk groups.
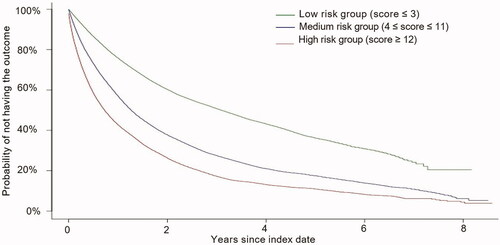
Table 5. Predicted risk of an unsatisfactory response for hypothetical patient profiles.
Supplemental Material
Download MS Word (65.8 KB)Data availability statement
The data that support the findings of this study are available from Optum, but restrictions apply to the availability of these data, which were used under license for the current study, and so are not publicly available. Any researchers interested in obtaining the data used in this study can access database through Optum, under a license agreement, including the payment of appropriate license fee.