
Figures & data
Figure 1. Forest plot of NMA results for percent change from baseline in LDL-C for base case population. Abbreviations. CrI, credible interval; NMA, network meta-analysis.
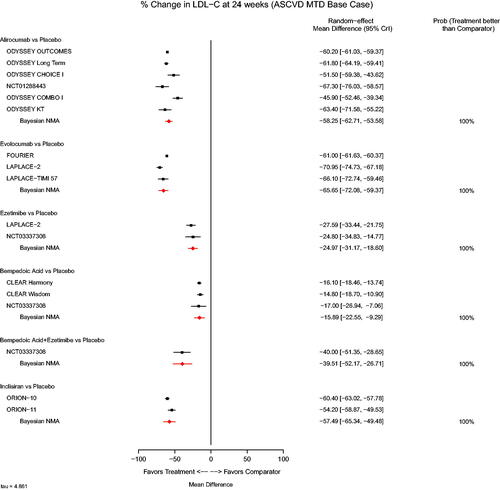
Table 1. League table NMA results for percent change in LDL-C for base case population.
Table 2. Results of sensitivity analyses based on varied data inputs for inclisiran for percent change in LDL-C for base case population.
Table 3. League table of NMA results for percent change in LDL-C for “all-comers” population.
Supplemental material