
Figures & data
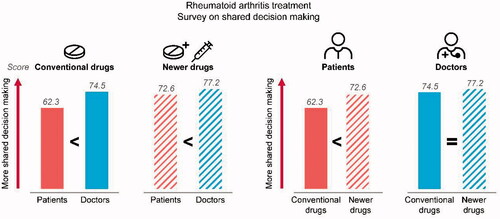
Figure 1. Study objectives. Research objectives in this study. The results of the survey of physicians and patients are used to assess the primary objectives. Secondary objectives are comparisons between conventional synthetic disease-modifying antirheumatic drugs (csDMARDs) and biological drugs/Janus kinase (JAK) inhibitors, and between patients and physicians. RA, rheumatoid arthritis; SDM, shared decision making; SDM-Q-9, 9-item SDM Questionnaire; SDM-Q-Doc, SDM Questionnaire-Physician version.
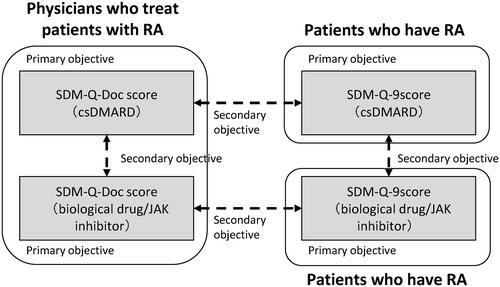
Table 1. Physician characteristics.
Table 2. Patient characteristics derived from the physician survey.
Table 3. Patient characteristics derived from the patient survey.
Figure 2. Shared decision making (SDM) scores for physicians and patients. Average SDM score from physicians and patients for each treatment category. The vertical axis shows the SDM score, and the error bar shows the standard deviation (SD). The numbers in the figure indicate the average value, and the numbers in parentheses indicate SD. p-values indicate comparisons between groups. csDMARD, conventional synthetic disease-modifying antirheumatic drug; JAK, Janus kinase; SDM-Q-9, 9-item SDM Questionnaire; SDM-Q-Doc, SDM Questionnaire-Physician version.
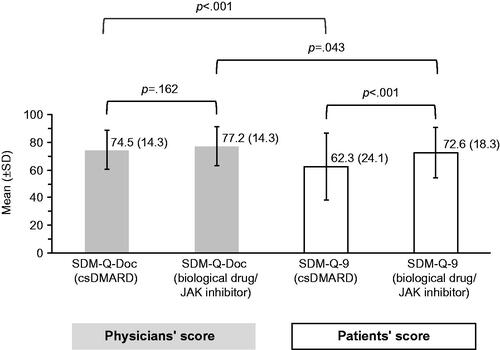
Table 4. Exploratory analysis for factors associated with physician implementation of SDM: Multiple linear regression analysis for SDM-Q-Doc scores, physicians prescribing csDMARDs and physicians prescribing biological drugs/JAK inhibitors.
Table 5. Exploratory analysis for factors associated with patient implementation of SDM: Multiple linear regression analysis for SDM-Q-9 scores, patients prescribed csDMARDs and patients prescribed biological drugs/JAK inhibitors.
Supplementary_revised.docx
Download MS Word (36.8 KB)Data availability statement
The raw data supporting the findings of this study are not available because consent was obtained from participants on the condition that it would not be disclosed to third parties.