
Figures & data
Figure 1. Number, age range, mean age, and median age (years) of the patients. 
 Median age
  Average age
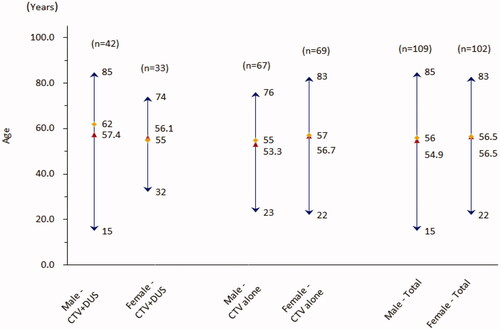
Table 1. Diseases and health status of CTV + DUS group.
Table 2. The reported number of deep vein abnormalities in lower extremities (by CTV alone, both CTV and DUS, and DUS alone).
Figure 2. Mix of lower extremity deep vein abnormalities reported by CTV and DUS. 
 CTV&DUS
  DUS
DUS  CTV
CTV  IIV
IIV  EIV
EIV  CFV
CFV  POV
POV  ATV/PTV
  PEV
PEV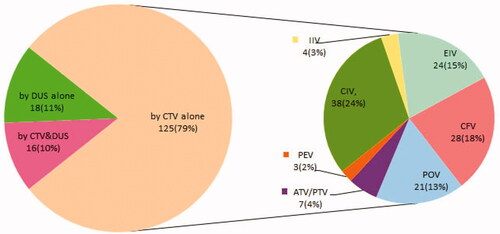
Table 3. The reported number of intermuscular and superficial abnormalities in lower extremities (by CTV alone, both CTV and DUS, and DUS alone).
Table 4. The number of abnormalities in the lower extremity veins reported in the CTV group.
Figure 3. Gender and left–right comparison of the ratio between the number of lower extremity deep vein abnormalities reported by CTV and the number of cases. 
 Male-right
  Female-left
  Female-right. Notes: *p < 0.05, left vs right for the same gender. #p <.05, male vs female for the same side. The ratios between the number of lower extremity deep vein abnormalities reported by CTV and the number of patients.
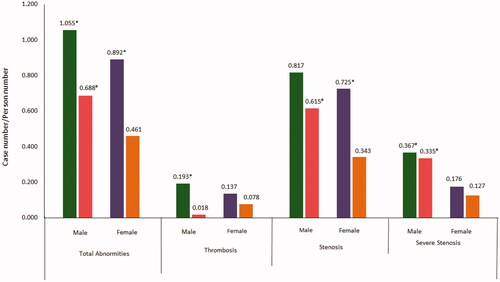
Figure 4. Percentages of the patients with lower extremity deep vein thrombosis (including old thrombosis) reported by CTV. 
 Fresh thrombosis
  None thrombosis
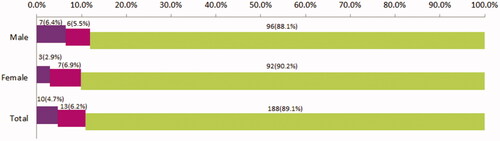
Table 5. The agreements and disagreement between the reports of CTV and intravascular angiography.
Data availability statement
All data generated or analyzed during this study are included in this published article.