
Figures & data
Table 1. Comparison of baseline characteristics between the non-infected group and infected group in patients with SLE.
Table 2. Localization and cause of infection (n = 162).
Figure 1. Multiple subpopulations of lymphocytes decreased in peripheral blood of SLE patients with infection. Absolute numbers of peripheral lymphocytes subpopulations were analyzed by flow cytometry. Data were presented as mean ± SD and statistical analysis was determined by one-way ANOVA. *p <.05, **p <.01, ***p <.001. (a) SLE patients (n = 495) have lower levels of T, B, NK, CD4 + T, and CD8 + T cells in PB compared with healthy controls. The numbers of PB lymphocytes in the infected groups (n = 162) was also much lower than those in non-infected patients (n = 333). (b) Comparison of numbers of CD4 + T cell subsets among different groups. Patients with SLE had lower levels of Th1 cells, Th2 cells, Th17 cells, as well as Treg cells compared with healthy donors (n = 132), especially the infected groups.
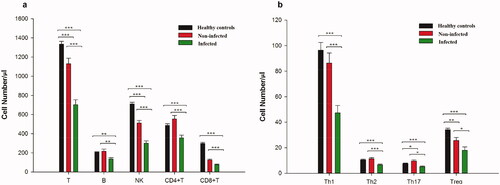
Figure 2. Multiple subpopulations of peripheral lymphocytes of SLE patients were significantly upregulated after low-dose IL-2 treatment (n = 54). Absolute numbers of lymphocyte subpopulations in peripheral blood were analyzed by flow cytometry. (a–i) Changes in the numbers of T, B, NK, CD4 + T, CD8 + T, Th1, Th2, Th17, and Treg cells. Comparison between amounts of cells at baseline and after the treatment. Data were presented as mean ± SD and were calculated and compared by paired-sample t-test. *p <.05, **p <.01, ***p <.001.
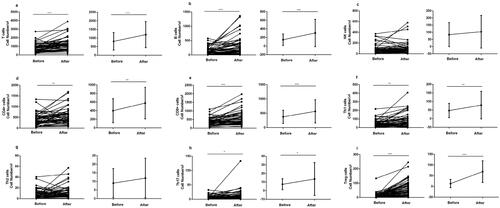
Figure 3. Lymphocyte subpopulations in patients with SLE (n = 54) were upregulated by IL-2 treatment and got to levels near healthy controls (n = 132). Absolute numbers of lymphocyte subpopulations in peripheral blood were analyzed by flow cytometry. Data were presented as mean ± SD and statistical analysis was determined by one-way ANOVA. *p <.05, ***p <.001. (a) SLE patients had a comparable level of T, B, CD4 + T, and CD8 + T cells in PB to healthy controls. (b) Comparison of the number of CD4 + T cell subsets among different groups. Patients with SLE had a comparable number of Th1, Th2, and Th17, and even higher Treg cells than healthy donors, especially the infected groups.
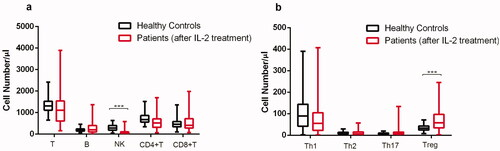
Table 3. Comparison of the number of PB lymphocyte subpopulations in patients with SLE before and after IL-2 treatment (n = 54).
Table 4. Comparison of peripheral lymphocyte subsets in patients with SLE before and after IL-2 treatment (mean ± SD).
Table 5. Comparison of peripheral lymphocyte subsets in patients with SLE after IL-2 treatment and HCs (mean ± SD).
Table 6. Comparison of baseline characteristics in patients with SLE before and after IL-2 treatment.
2022.3.30concise_description_of_supplementary_material_file.doc
Download MS Word (32 KB)Data availability statement
All data generated or analyzed during this study are included in this published article.