
Figures & data
Figure 1. Flow-chart for patient inclusion criteria. *IBM Study Period: January 1, 2014–September 30, 2018; Optum Study Period: January 1, 2014–March 31, 2019; IQVIA Study Period: January 1, 2014–December 31, 2018. **IBM Identification Period: January 1, 2015–September 30, 2017; Optum Identification Period: January 1, 2015–March 31, 2018; IQVIA Identification Period: January 1, 2015–December 31, 2017.
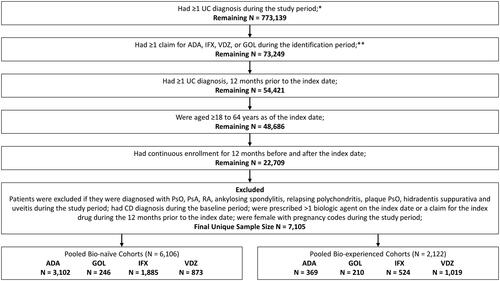
Table 1. Descriptive baseline characteristics for pooled bio-naïve and bio-experienced patients.
Figure 2. Unadjusted persistence rates among UC Patients during 12-month follow-up period using variable gap definition*. *Variable definition for ADA was 28 days; GOL was 56 days; IFX and VDZ was 112 days.
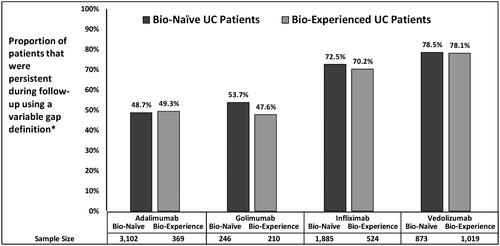
Table 2. Treatment patterns for pooled bio-naïve and bio-experienced patients.
Table 3. Dosing titration for pooled bio-naïve and bio-experienced patients.
Data availability statement
Due to data user agreement between the authors and the data vendor, data cannot be made publicly available.