Figures & data
Figure 1. CONSORT diagram.
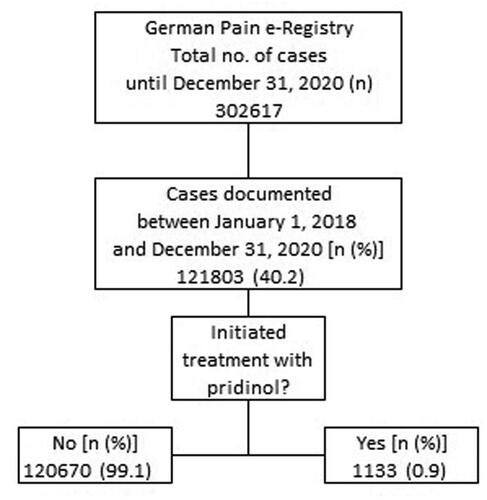
Table 1. Patient demographics.
Table 2. Baseline pain characteristics.
Figure 2. Change from baseline to end of treatment for the average 24-h pain intensity (PIX). (a) The black lines represent baseline values for each individual patient, sorted by severity. Individual grey lines represent the change from baseline at end of treatment for each individual patient. The pre (baseline; BL) and end of treatment (EoT) boxplots show median (middle horizontal line in the box), and quartiles 25% and 75% (bottom and top lines of the box); whiskers correspond to the 5–95% quantiles; numbers given in boxplots are median (mean). (b, c) Show the absolute (mm VAS) and relative (percent) changes versus baseline for each individual, sorted by severity (i.e. identical to figure a) and boxplots show the corresponding median, 25–75%, and 5–95% quantiles as well as median (mean). Abbreviations. PIX, pain intensity index; VAS, visual analogue scale; CI, confidence interval; BL, baseline; EoT, end of treatment; ES, effect size; 95% CI: 95 percent confidence interval.
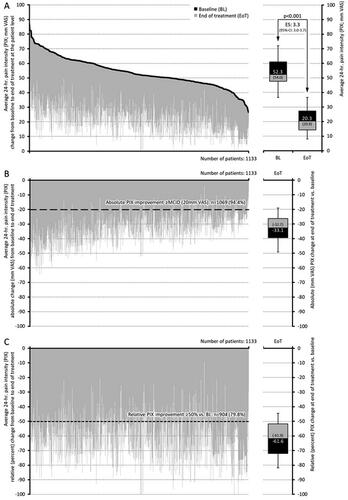
Figure 3. Change from baseline to end of treatment for pain-related disabilities in daily life (mPDI). (a) The black lines represent baseline values for each individual patient, sorted by severity. Individual grey lines represent the change from baseline at end of treatment for each individual patient. The pre (baseline; BL) and end of treatment (EoT) boxplots show median (middle horizontal line in the box), and quartiles 25% and 75% (bottom and top lines of the box); whiskers correspond to the 5–95% quantiles; numbers given in boxplots are median (mean). (b,c) Show the absolute (mm VAS) and relative (percent) changes versus baseline for each individual, sorted by severity (i.e. identical to figure a) and boxplots show the corresponding median, 25–75%, and 5–95% quantiles as well as median (mean). Abbreviations. mPDI, modified pain disability index; VAS, visual analogue scale; CI, confidence interval; BL, baseline; EoT, end of treatment; ES, effect size; 95% CI: 95 percent confidence interval.
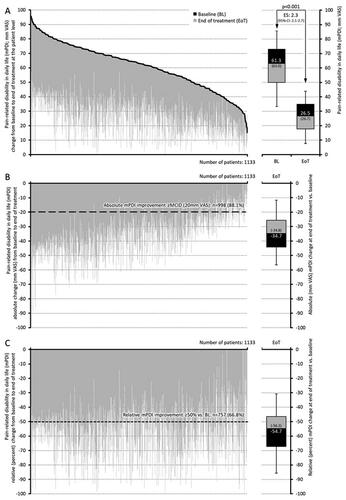
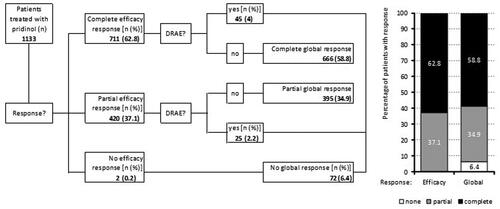
Figure 4. Response (percent improvement between baseline and end of treatment) to pridinol. Notes: Left panel: cumulative proportion of patients with percent improvement for the average 24-h pain intensity (black) and the pain-related disabilities in daily life (grey). Right panel: categorial groups of patients with defined degrees of response to pridinol at end of treatment versus baseline.
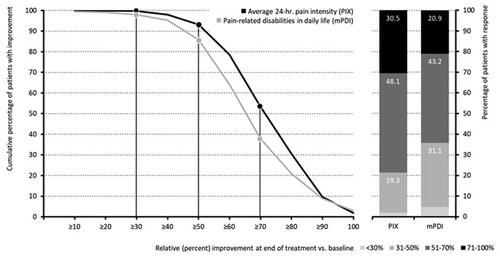
Table 3. Response to treatment.
Figure 5. Scatterplot of the improvements for the average 24-h pain intensity index (PIX; x-axis) and the pain-related disabilities in daily life (mPDI; y-axis) at the end of treatment [each given as absolute (mm VAS) improvement versus baseline]. Notes: Dotted diagonal shows the linear correlation trend (incl. the coefficient of determination R2). Abbreviations. PIX, pain intensity index; mPDI, modified pain disability index; VAS, visual analogue scale.
![Figure 5. Scatterplot of the improvements for the average 24-h pain intensity index (PIX; x-axis) and the pain-related disabilities in daily life (mPDI; y-axis) at the end of treatment [each given as absolute (mm VAS) improvement versus baseline]. Notes: Dotted diagonal shows the linear correlation trend (incl. the coefficient of determination R2). Abbreviations. PIX, pain intensity index; mPDI, modified pain disability index; VAS, visual analogue scale.](/cms/asset/c333b89b-5020-4d2f-bd53-02f08ddf1ffa/icmo_a_2077579_f0005_b.jpg)
Table 4. Changes in analgesic medication.
Table 5. Drug-related adverse events.
Figure 6. Summary of efficacy and tolerability information relevant for the primary endpoint calculation. DRAE: drug-related adverse event.